The employment report, as it always does, captured the most attention, but it was the wholesale inventory/sales report that deserved the widest audience. There will be plenty to say about the real employment situation currently (I will have a subsequent post devoted to earned income and job bean counting), but any discussion of jobs has to start with a broader economic context; everything is relative.
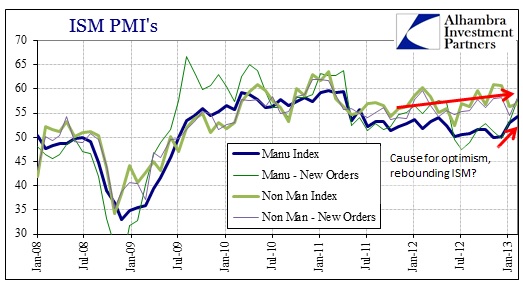
No doubt part of the cheer taken from this morning’s BLS headline is due to the apparent harmony with other “favorable” reports in the past few weeks. Chief among those optimistic data points was the ISM numbers for both manufacturing and non-manufacturing. In particular, the manufacturing side appears to have weathered the dramatic slowdown in the middle of last year.
According to the ISM’s estimations, it looks as if the rough spot has past and a new upward trend has resumed. If the trend is real and perhaps durable, it should be corroborated by other data series.
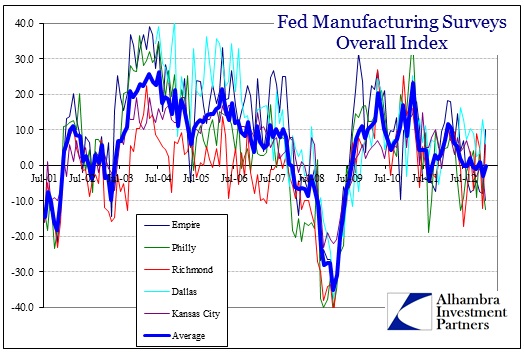
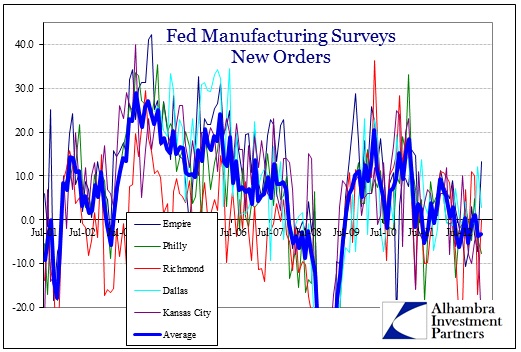
Staying in manufacturing, we start with the five regional Fed surveys for manufacturing. Unfortunately, in the aggregate the surveys show no such rebound, contrary to the ISM.
Clearly there has been volatility across the five regions, but nothing really out of the ordinary. In February, for example, the Empire and Richmond surveys showed signficant improvement from dramatic weakness in January. But the Philly and KC surveys showed the exact opposite, while in Dallas conditions slowed. If there was a conclusive rebound in manufacturing, it has not appeared here.
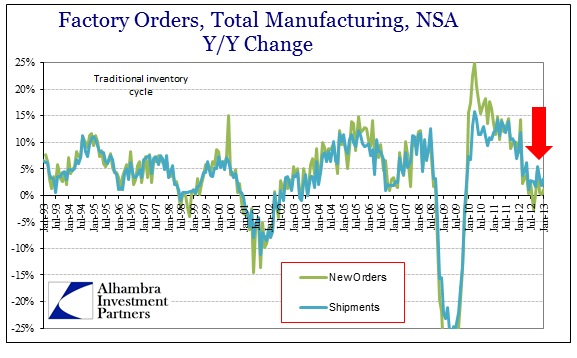
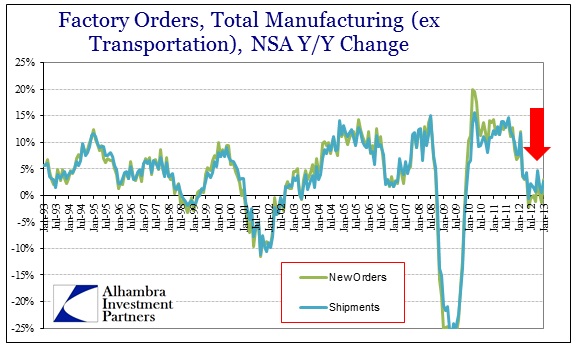
Shifting to factory orders (the broader cousin of the durable goods report), the pattern shown here is more like the Fed surveys than the ISM.
Even if we back out the volatile transportation sector, the data is slightly weaker.
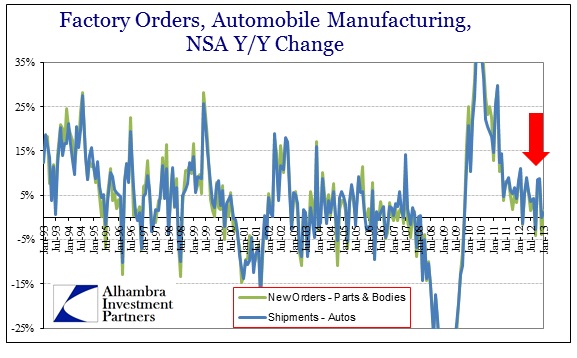
Even in the automobile space, the one true bright sector in manufacturing – indeed the entire economy, there is a noticeable change in pace belying the ISM pattern.
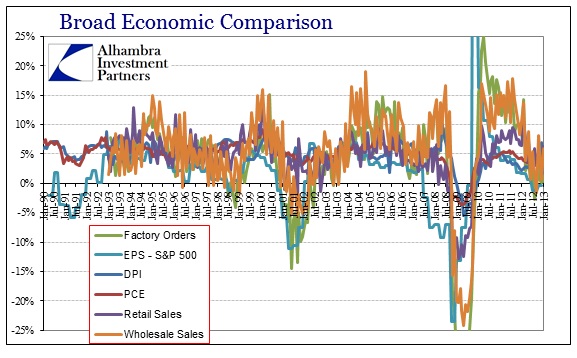
In fact, if we take a very broad cross section of economic data series beyond just manufacturing, we get a much sharper picture of the wider economic context. To accomplish this I have included six indications of various economic parameters collected across different sources:
• Factory Orders; not adjusted, Y/Y % change; Census Bureau
• Earnings Per Share; trailing twelve months, Q/Q % change; Standard & Poors
• Disposable Personal Income; seasonally adjusted, Y/Y % change; Bureau of Economic Analysis
• Personal Consumption Expenditures; seasonally adjusted, Y/Y % change, Bureau of Economic Analysis
• Retail Sales; not adjusted, Y/Y % change; Census Bureau
• Wholesale Sales; not adjusted, Y/Y % change; Census Bureau
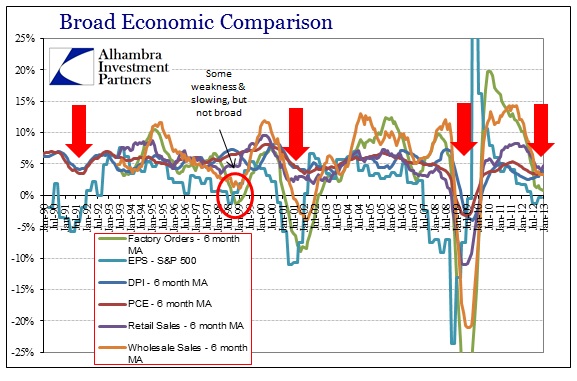
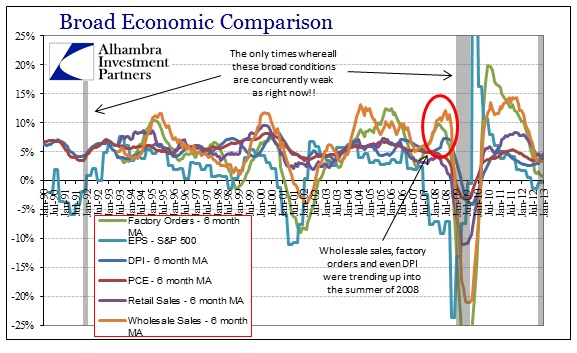
It might not be the clearest in the above chart, so we can clean it up a bit by using 6 month moving averages (trends) where appropriate.
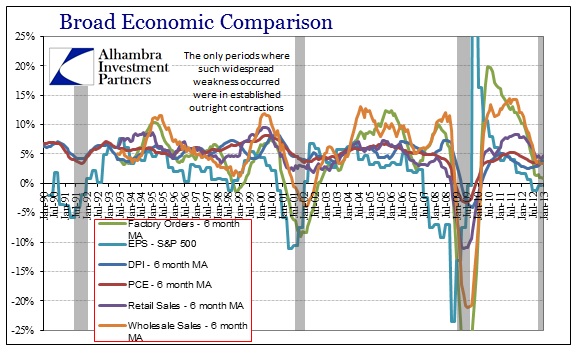
Here the broad economic context is very clear. From the personal sector (including income and spending) to the upper levels of the supply chain (retail and wholesale sales), to the lower levels of the supply chain across goods categories (factory orders) to the overall corporate environment (EPS), a slump has emerged that the economy has yet to shake free.
For an even broader context, we can compare the current slump across the past few decades. To get a historical sense in an attempt to gauge relative severity, I screened for any other months that showed the same or worse in all six data points. The only times this current slump was matched in the historical context were: October 1991 and December 2008 – September 2009. That’s it.
It should be noted that the wholesale and retail sales data only go back to 1992, so they are obviously not included in screening months prior to their inception.
In the first half and summer of 2008, wholesale sales and factory orders were actually trending higher (much like the ISM currently) while DPI had yet to significantly tail off. So even that period in the Great Recession featured more economic resilience than we see currently – which is even more shocking given all the monetary “stimulus” (shocking at least to those that believe QE is a net positive).
Even if we loosen the criteria on DPI and PCE to 5% nominal growth, it only adds months at the end of the 1991 recession and its immediate recovery and the second half of 2001. In other words, given these broad economic criteria the only times this level of weakness has been replicated has been months in the depths of recession or immediately following.
The improvement in the ISM numbers don’t conform at all to the broader economic context, except if we allow for an inventory cycle within that comprehensive trend. Even a secular economic decline will see mini-cycles of ups and downs in certain data related to additional factors (such as factory orders and wholesale sales in 2008). It is certainly possible that the ISM is picking up a rebound in inventory after the recent pause (which showed up in the GDP report as subtracting significantly from overall GDP growth) in the fourth quarter.
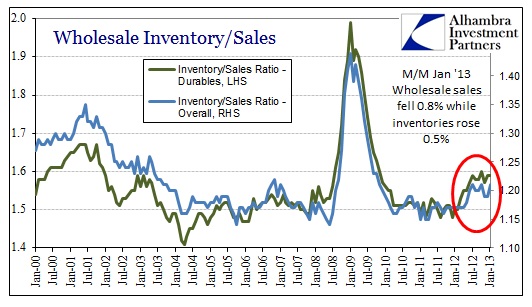
That is why today’s wholesale numbers from the Census Bureau were, to my mind, important in explaining how these numbers might fit together in the larger trend. The wholesale figures seem to confirm that analysis as the inventory/sales ratios in Q4 were largely stagnant to slightly lower, but have moved again upward in January.
If that is the correct interpretation, and I think it is, then we should see this current inventory rebuild wane in the coming months as the broader sales picture driven by the weakening personal sector simply pushes up inventory ratios still further. The supply chain will signal those undesirable inventory levels and induce another inventory pause or worse. The impact of this mini-cycle in inventory in the context of a wider slump will likely play out across all the manufacturing numbers at some point, much like the first inventory/manufacturing “hole” in middle of 2012.
This context is important to establish a basis for analysis of individual economic series as part of the whole system dynamic, including the employment picture as the economy moves along this now-established trend (again, I will give my analysis of the jobs report in a separate post).

Stay In Touch