
The physical markets for precious metals do operate under the philosophical framework of basic economics. The price of gold, for example, will move based on underlying demand and supply dynamics though it appears to have taken a break from that relationship recently. Unlike industrial commodities, however, gold still occupies monetary spheres, particularly interbank liquidity. That complicates the basic economics of price, especially where physical gold and accounting rules meet in the esoteric and opaque language of swaps and leasing.
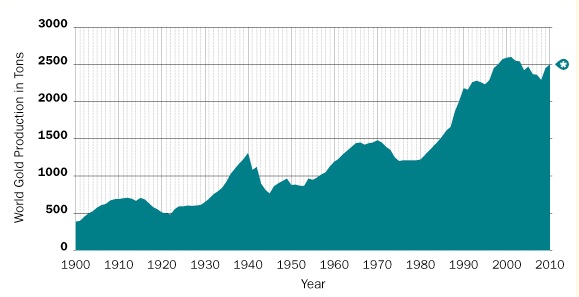
But again, at the big picture level the physical markets operate largely as you expect. Since all the historical gold ever mined is still in existence in some form, the underlying changes in supply and demand are expressed through both new production and the method of storage. Mine production soared after 1980 and gold prices swooned for nearly two decades.
In terms of storage, gold largely fell out of investment hands and into other storage forms (such as jewelry). In 1980, there were about 3.5 million ounces of gold in inventory at the COMEX. By 2001, inventory on the COMEX had fallen all the way to 1 million ounces. Gold had completely fallen out of favor in terms of investment usage – it was no longer exhibiting mostly monetary properties.
The decade of the 2000’s, however, saw exactly the reverse. Mine production stalled and prices rose. It was also coincident to the Washington Accord terms where central banks (mostly in Europe) limited their leasing activities and miners themselves nearly crumbled under the weight of their 1990’s hedges (Anglo the primary example).
With dollar debasement in full and obvious view, demand for gold rose but supply was now constrained through “normal” channels. That brought gold out of “other” uses and into investment hands. Where investable gold turned to jewelry and such in the 1980’s and 1990’s, it reversed with rising prices in the 2000’s. By 2009, the physical demand for “stored” gold was such that every major street intersection in most populated areas featured “dynamic” advertisements to exchange grandma’s gold necklace for devaluing cash.
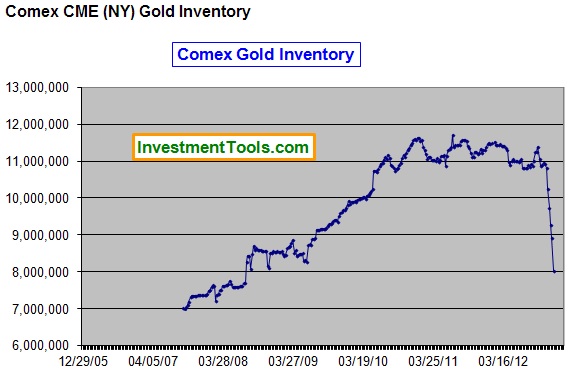
That was reflected in the inventory at the COMEX – where only 1 million ounces had existed in investable form in 2001, by 2011 inventory had grown to 11.5 million ounces.
So the exchange between stored gold and investable gold largely was determined by the overall price trajectory. It stands to reason, then, that if investor expectations for gold prices in dollars (and any other currency) were to once again reverse, expecting an end to the “bull market” in gold (which is a misnomer since it is really just a bear market in dollars), we should expect another drawdown of investable gold inventory back into jewelry and other “stored” uses.
That appears to be what has happened since gold prices peaked in 2011. COMEX inventories have dropped by a huge 3.5 million ounces, so it does look as if this action conforms to the expected end of the bull market.
The major problem with that narrative is that gold inventories have crashed in 2013. While COMEX stores were largely stagnant even before the price peak in September 2011, nearly all the inventory reduction takes place in a very condensed time period. That speaks to something other than a transfer from investable gold to stored gold. There has not been a massive surge in jewelry nor a newly discovered industrial use for gold that could explain this dramatic and sharp physical change in inventory intentions.
At the same time gold is leaving the COMEX, it has been drawn out of the GLD exchange traded fund (they may actually be some of the same gold). At the outset of 2013, GLD showed 43.4 million ounces in trust. As of May 10, there were only 33.8 million ounces, a loss of some 300 tons.
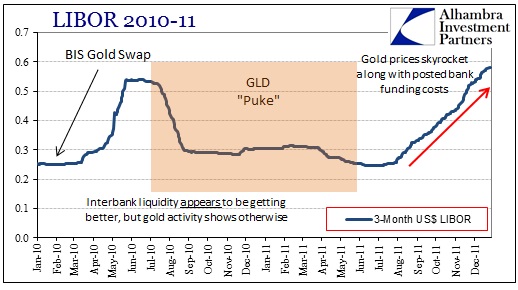
Between July 2010, and May 2011 GLD also “puked” 129 tons of gold. Only a few months prior to that, the BIS had conducted a “hidden” gold swap operation of about 346 tons with major European commercial banks that were under dollar funding stress. The BIS operation was somewhat counterintuitive in that European banks were “awash” in bullion from all the metal that had flowed from “stored” to “investable” gold in the 2000’s. There simply should not have been any need for banks to secretly access BIS holdings absent that unrelated liquidity factor.
For the most part, the media sees the decline in GLD (and other ETF) holdings of gold as evidence of declining demand when in fact it is no such thing. GLD is created by excess holdings of metal at bullion banks. When they have unused bullion (unallocated accounts) they can create a basket of GLD shares in their capacity as Authorized Participants. Think about the creation/retirement of GLD shares (baskets) as competing uses of “spare” unallocated metal. When interest rates on cash lending are comparatively more profitable, the bullion bank will “lend” gold to the GLD trust and gain access to cash. If lending cash is less profitable than lending gold to the funding market, gold is reclaimed from GLD to take advantage of the greater profit opportunity in the collateral lending markets.
Back in 2010-11, bullion banks found it more profitable to reclaim supply from GLD to lend out to commercial banks in gold leasing arrangements because commercial banks, particularly in Europe, were desperately short of funding and thus were forced to pay higher lending costs compared to the opportunity cost for bullion banks in unsecured cash lending. In this way, bullion banks act as the marginal supplier of funds through either secured or unsecured terms, and thus swing marginal funding between the two based on opportunity differentials in both markets.
In 2013, published GOFO rates (the rate LBMA “contributors” state they will offer for lending on gold collateral) have been lower than published LIBOR (though higher than Eonia). But if we think about gold leaving GLD in the context of opportunity cost between lending cash at unsecured terms or lending gold at something greater, we can surmise that some banks are likely paying greater rates than published GOFO – otherwise why would bullion banks be pulling gold back from the trust?
One explanation for this withdrawal of physical stock is the distrust over paper claims, and thus the beginning of the end of the paper vs. physical market imbalance. But if that was the primary driving factor in gold markets, spot gold prices would be rising not smashed. Because gold prices have fallen while inventories have shifted, I believe this conclusively points to collateralized lending markets and bullion bank opportunity costs rather than the final paper gold devolution. That does not mean paper gold markets will not fail at some point, I just do not believe the evidence shows it is happening at this moment.
Further, I think this is more evidence of gold collateralized lending done so off the published rates. Again, it bears repeating that posted and published interest rates like GOFO and LIBOR apply only to the largest banks in the world. Smaller participants in money markets pay whatever rate is necessary to obtain liquidity – the more desperate they are the more they will pay. It is a tiered and fragmented liquidity structure. This was something we saw with regard to the Great Depression – published interest rates did not denote real liquidity conditions because the funding markets were decidedly fragmented.
While I have focused solely on Europe as the target for illiquidity, I still cannot discount Japan. Not only do the Bank of Japan’s actions drive retail demand for gold, but the recent extreme volatility in the JGP market can only be a stress on interbank liquidity (as well as the reduction in collateral due to Japanese QE). It could very well be that physical bullion is heading east to not only China and India, but also Japan and wholesale yen markets (particularly given gold prices in yen).
I think when you view gold inventory movements through the lens of bullion bank (liquidity providers) opportunity cost you can peer through the façade of published interest rates into the deeper context of the banking system beyond protestations of “normalcy”. Everything tells us that fragmentation is not only prevalent, but perhaps semi-permanent. While conventional economists and central bankers revel in the collapsing gold price, in the longer run this is gold positive as demand continues regardless of current prices. After all, huge demand for physical metal is not equivalent to a massive smash in prices. Something else is going on here, and bank funding is likely in the middle (again).
Stay In Touch