
I wanted to concur but take Joe’s weekend proposition in a slightly different direction. I think it is relatively clear that the Federal Reserve and Chairman Bernanke are intentionally hinting at “tapering” QE purchases in order to “talk the market down”. There are a lot of similarities between the monetary communications right now and 1996 when Alan Greenspan famously appealed against “irrational exuberance”.
“But how do we know when irrational exuberance has unduly escalated asset values, which then become subject to unexpected and prolonged contractions as they have in Japan over the past decade?”
The former Fed chair placed blame, by his phrasing, squarely on the shoulders of overwrought investment enthusiasm. He has never reconciled that enthusiasm with causal factors beyond that appeal to emotion. But emotion is simply not enough to foster exuberance of any kind, irrational or otherwise.
By any means, it is easy to see the effects of this in any metric defining market valuations. The extreme levels of the late 1990’s and early 2000’s are beyond historical comparison. That they could have moved so far out of line with normative prior behavior, even the extremes were extreme, suggests a powerful change in the character of asset prices.
Conventional measures of asset values, to varying degrees, capture the persistence of extremes. Beyond the traditional price to earnings metric, there are a few alternative methods to valuing stocks as a group. We can, for example, take the entire value of the equity universe and judge it against a fundamental economic base, such as GDP, to see if it continues to align with Greenspan’s observation. But that is an incomplete measure. Since a growing portion of larger corporation revenue and income is derived from sources outside of the domestic economy, such a measure would unfairly penalize price appreciation of successful businesses that are gaining foreign market share.
In such an instance, it would be perfectly valid for stocks to rise at say 10% per year even if GDP growth is say 2%. As long as foreign-derived net income is growing fast enough to justify such a price expansion, GDP is an incomplete basis for judging fundamental corporate value. Indeed, that has been the case for US corporations for much of the past few decades, so there is an easy case to be made for stock prices rising faster than GDP.
Fortunately, there are alternative fundamental anchors against which to judge the degree of artificial inflation in the stock market. Clearly, Greenspan’s incomplete warning is relevant to prices beyond the snapshot of late 1996. If valuations today are similar in kind to that period, then we can infer both similar artificiality and perhaps even common causality.
An easy and intuitive measure is Tobin’s Q. Here we simply find the market value of corporate equities and compare that to the total net worth of non-financial businesses in the United States. Thus it captures the price variable and does not penalize businesses that are successful in other geographies.
These two measures are found in the Federal Reserve’s Flow of Funds Report (Z1), in Table B.102 Balance Sheet of Nonfinancial Corporate Business.
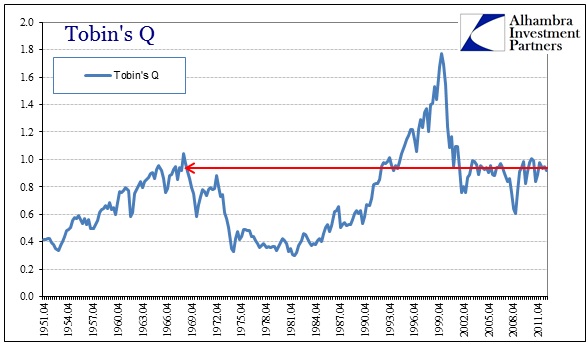
In historical terms, the current measure of Q is pretty much aligned with the market corporate valuations after the dot-com bust. However, these figures are dated since the latest Flow of Funds Report is for the fourth quarter of 2012. Given the rapid rise in stock prices since then, it is likely that the current Q reading is significantly higher, perhaps as close as 1.0.
Up until Q4 ’12, corporate net worth had more than kept pace with the ascent in stock prices. Since the end of 2009, corporate net worth had grown about $4.3 trillion against a $3.7 trillion increase in the total market value of equities. That reduced the Q ratio since 2009, appearing as if the market has been fairly valued, or at least consistent, during the recovery from the Great Recession.
Out of that $3.7 trillion in “new” net worth, $2 trillion was due to an increase in the market value of corporate real estate. Since this is not the carrying cost or book value, it is susceptible to price inflation, and thus as a means to measure asset inflation and expensive markets, it amounts potentially to statistical noise. For example, if the Fed is “successful” in stimulating credit that flows into both real estate and stock prices, yielding “expensive” markets in both, the current measure of Q would not reveal such a rise since both the numerator and denominator are captured by the same process – there would be no true fundamental anchor by which to determine stock price “froth”.
If we adjust the Q ratio by taking real estate assets out of the corporate net worth measure, we do actually see the behavior of stocks and the effects of asset inflation in real estate.
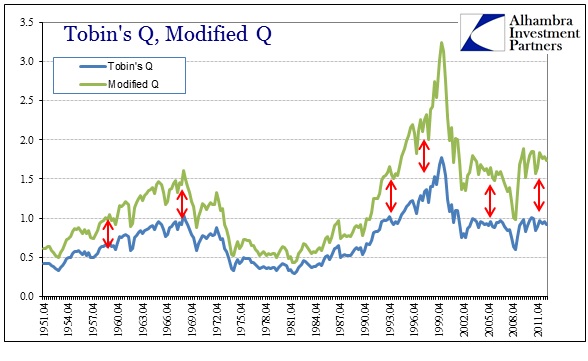
As you would expect, this modified Q shows a more expensive market absent rising asset prices in real estate values. That suggests that asset inflation in real estate has at least in part been a source for increasing prices in stocks. On a historical basis, the current reading from Q4 ’12 is 8% above the market peak in 1968, and equivalent to market valuations seen in early 1995.
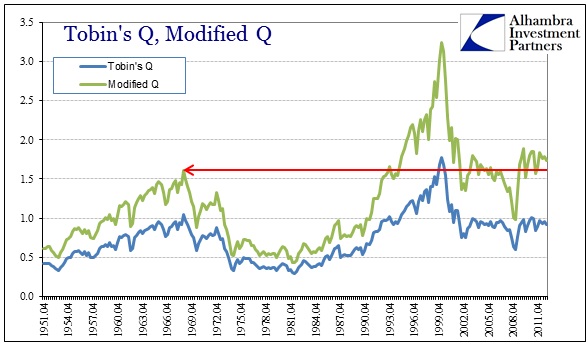
From these comparisons, we see that the market may in fact be historically expensive, particularly when taking into account other channels of inflationary money.
But for a more robust interpretation, we need a larger sample. Fortunately Robert Shiller has compiled market information going back to 1871. This data set forms the basis of his Cyclically Adjusted PE (CAPE) metric of market valuations.
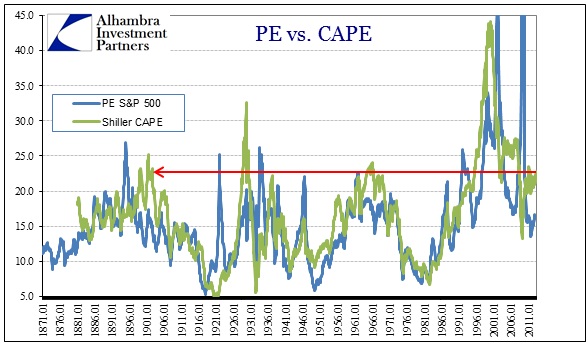
Against the straight PE ratio, the CAPE measure smooths the often disjointed variability in the conventional PE multiple (particularly during recession). But here again we see valuations that are inordinately above historical measures, more consistent with market tops (pre-2000) than “fairly valued”. In fact, the CAPE chronology is extremely close to the modified Q.
Even using the conventional PE, which we know from S&P is currently about 19, the results are not all that dissimilar.
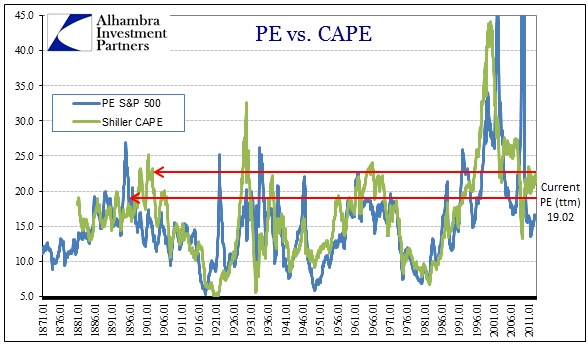
Further, it is absolutely clear that valuations post-1995 have not reverted to the theoretical mean. Even in the crash of 2008-09, at best CAPE valuations fell to about the arithmetic mean of 16.4, but did not linger there.
But these comparisons in themselves do not convey enough information to make any solid determinations. Firstly, measures such as PE’s are not normal distributions, so the typical method of statistical evaluation is not as meaningful. PE’s conform to Pareto distributions that follow power laws. Given that, a better measure of extreme valuations is filtering historical values through quintile or decile groupings to determine how long markets actually remain at certain valuation levels.
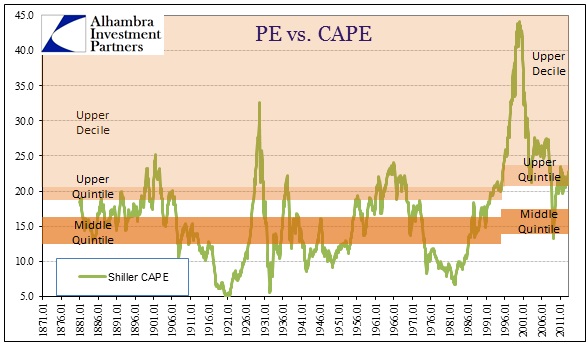
From this perspective, current market CAPE falls in the upper quintile of the distribution, a relatively expensive proposition itself. But even here, as we have seen, the market has remained largely in the upper quintile for the whole of the 21st century. That has the effect of skewing these distributions, unless we accept the premise that the entire valuation complex has shifted permanently since 1995 or so (making Greenspan’s warning all the more poignant in ways he never imagined).
What counts as upper quintile now would have been in the upper decile prior to the dot-com bubble and intense inflationary burst. The demarcation of the 90th percentile across the whole chronology is 23.7, but it was much lower at 20.98 before 1995. That means the current reading of 22.79 is at a historical extreme by pre-1995 standards.
The same largely holds true for the plain PE distribution. The 90th percentile for the entire period is 21.4, but only 18.85 pre-1995. Like CAPE, the current reading of 19.02 would have been in the upper decile using pre-1995 data alone.
By any standards, the current market is at least in the upper quintile of earnings multiple distributions. The real question, getting back to why I wanted to modify Q, is whether the past two decades represents a durable paradigm shift in valuations. In my opinion, it merely clarifies the extreme means through which monetarism has pushed asset prices far above historical norms.
That such a process can happen across multiple asset inflation outlets makes the comparisons all the more tricky. Given that earnings multiples were almost entirely well-behaved before the late 1990’s suggests that there has been a common factor in changing the character of the distribution, and further maintaining that imbalance for more than a decade. Again, we don’t have to grope and search for that factor, it is clearly the growth and dominance of monetarism in the interest rate targeting/shadow banking regime. The sheer amount of credit production in that period compared to the whole economic history before it is not simple coincidence – followed by the activation of that massive central bank liquidity backstop post-2007.
The prime question now is whether these effects are permanent, or still in process of unwinding. The fact that asset bubbles have appeared and burst in relatively close proximity during this period is highly suggestive of the latter rather than the former. Extreme valuations are extreme for a reason – they do not last, otherwise they would be “normal”. So there are really only two likely outcomes, a new distribution of where formerly extreme valuations are fully commonplace or the inevitable reversion to prior historical norms.
In the end it is all simple currency debasement, a form of instability that is consistent with extremes in other parameters. That is also why these extremes were once rare – the instability that it takes to push to those levels is self-extinguishing in their reverse. The difference since 1995 is simply the degree to which central banks have gone to delay that inevitability. They have failed on two occasions; there will very likely, as this data suggests, be a third. While some may call that mean reversion, I think it more akin to a center of gravity and entropy related to the fact that, despite technological advances and evolution in the “science” of banking and monetarism, human nature and frailty applies not just to irrational investors, but equally to exuberant central planners.
Click here to sign up for our free weekly e-newsletter.
“Wealth preservation and accumulation through thoughtful investing.”
For information on Alhambra Investment Partners’ money management services and global portfolio approach to capital preservation, contact us at: jhudak@4kb.d43.myftpupload.com
Stay In Touch