
Since monetary policy depends on credit to realize any kind of “wealth effect”, debt issuance and levels are thus secondary indications of non-organic consumer or household funds availability. Rising mortgage levels are not only consistent with rising home prices, but also the tendency of mortgages in that situation to allow home owners to capture and then use excess home equity for spending.
So far, the effect of the collapse in mortgage applications and the retreat of investment firms from real estate and mortgages has yet to really show up in issuance data. There was certainly a noticeable change in trend, but the bulk of the decline has yet to appear (which is expected given the lag between applications and completed financing). Mortgage applications began to fall coinciding with the bond selloff in May, so the first waves of reduced activity are just now being realized.
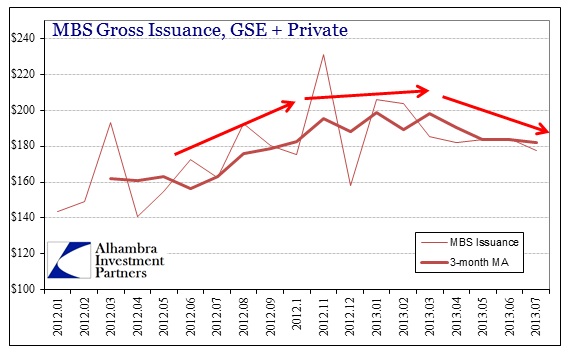
GSE issuance actually fell off earlier in the year as private label financing staged a bit of a comeback due to some structural changes (including PMI requirements) at GSE lender conduits. However, the damage was quite severe in August as GSE issuance was down 9.3% from July. A total of $131 billion in gross issuance was the lowest since December. That means there was at least still activity taking place in the private label markets, but that will not last given the ongoing collapse in demand.
As a whole, however, banks have already seen a decline in their mortgage portfolios (strictly loans, does not include holdings of MBS).
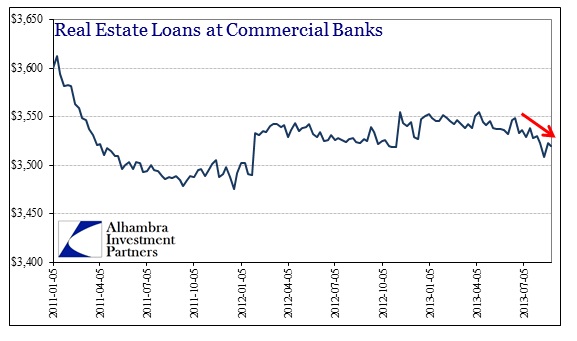
The trend matches chronologically with funding market volatility and the related bond market selloff of May 2 – June 24.
If there is less demand for mortgage and real estate loans, coupled with the growing interest rate and liquidity risks of holding fixed income securities, where do banks turn for their asset deployment?
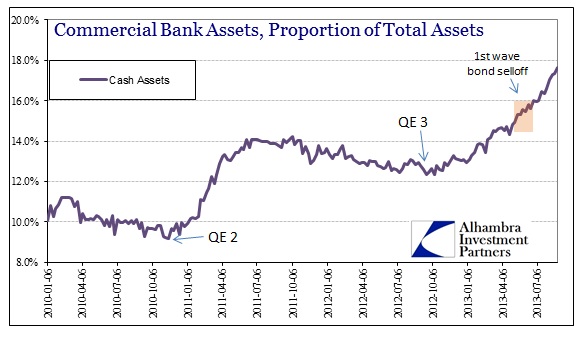
While there is little doubt that cash at banks (concentrated at the largest banks, including the primary dealers) is being skewed by QE’s impact, adjusting for the cash holdings we see that banks are actively moving out of fixed income altogether.
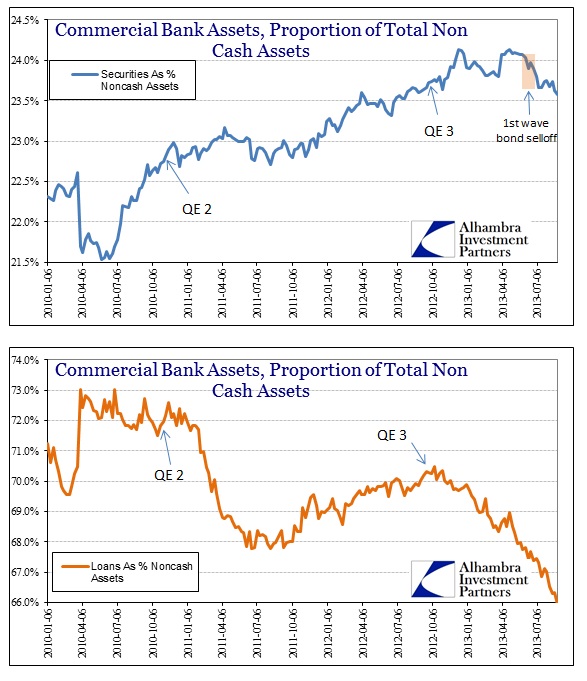
The effect of QE on bank loans is rather stark and obvious – QE entices banks to participate via securities, lightening the loan book proportionally. The growth of securities in the banking system portfolio, however, only took a large U-turn during the recent bond selloff.
What we can tell from all of this data is that banks are de-risking at a rising rate. The clear avoidance of any fixed rate investment speaks to the level of perceived risk implied in policy uncertainty (not economic or inflation uncertainty) that is flowing through into credit conditions. In absolute terms, the overall numbers might not seem large, but at the margins of credit production, particularly engaged during such massive, direct “stimulus”, these changes are significant. Total bank assets since May 1 have grown by about $329 billion, while cash balances have risen an astounding $440 billion. That left loan balances essentially flat, but securities portfolios down by $84 billion (with $49 billion coming from MBS alone).
I think the most important takeaway here is that while households appear to be reducing risk (much lower mortgage debt demand) as a result of the paradigm shift in rate structure banks are following suit. Instead of redeploying away from bonds and securities to some other asset class or sector, banks are simply sitting on cash at a growing proportion. They were not exactly fully enthralled with risk to begin with, as the loan proportion history shows, but are now retreating from credit production almost fully and across the board.
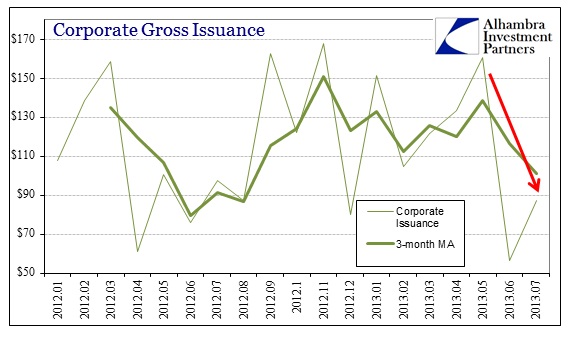
It should be noted that Commercial and Industrial Loans grew slightly in May (+$23 billion), but have largely remained flat since (+$1.5 billion). Given that corporate bond issuance has fallen off a large cliff in the past two months, the banking trend would be a highly negative factor in business investment and operational perceptions.
The question now is whether this is temporary, or a new and lasting trend. In any event, given the timeframe here, it is difficult to see how rosy economic forecasts are going to be maintained as banks again engage in delevering. The difference now is that the bond market is participating as well, cutting off that vital credit bypass. That might put pressure on corporate liquidity perceptions, meaning that companies could be marginally willing to hold even greater cash balances, cutting back on costs and therefore cash outflows.
Since all of these downward trends are linked to the flow-through of policy perceptions on interest rates and the bond selloff, it is very interesting to see the very close parallels developing between the past four months compared to 1936. In real economy terms, what happened in 1936-37 was exactly that – as banks renewed de-risking in the wake of monetary policy changes, companies increased liquidity and cash preferences despite criticisms and appeals of “already high” idle cash balances. Those historical echoes are growing stronger by the month.
Click here to sign up for our free weekly e-newsletter.
“Wealth preservation and accumulation through thoughtful investing.”
For information on Alhambra Investment Partners’ money management services and global portfolio approach to capital preservation, contact us at: jhudak@4kb.d43.myftpupload.com
Stay In Touch