
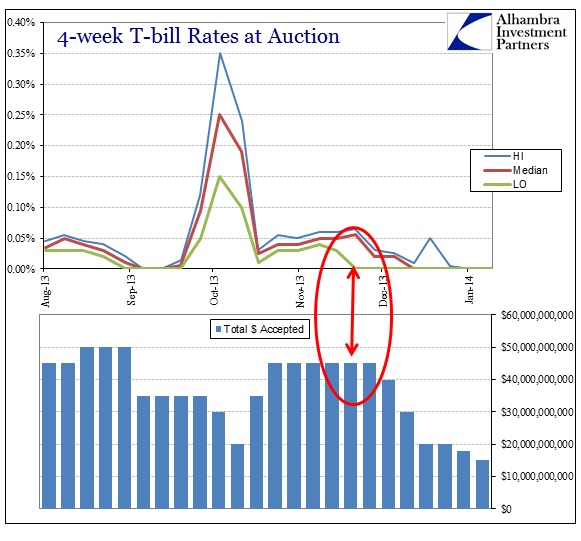
While I would love to be talking about the Buffalo Bills in the AFC Championship game, or at least the addition of some kind of competency in some form (any) for the team, this post is dedicated instead to the newest mechanics in treasury bills. The most recent 4-week bill auction went off at 0.0%, in a string of zero rates beginning in late November. In the recently concluded 13- and 26-week bills, there is noticeable decline in yields. Of course, these results factor into secondary market prices.
The last time we saw such “drama” was the beginning of September (which included a still-unexplained computer glitch surrounding the bid of Goldman Sachs). As is usually the case, a systemic drop in t-bill yields to or below zero is not really related to “fear” or a “flight to safety” but rather a collateral shortage or spike in demand. In the September episode it was easy to digest the looming debt ceiling drama and the attendant decline in bill issuance as the federal government briefly attempted fiscal restraint.
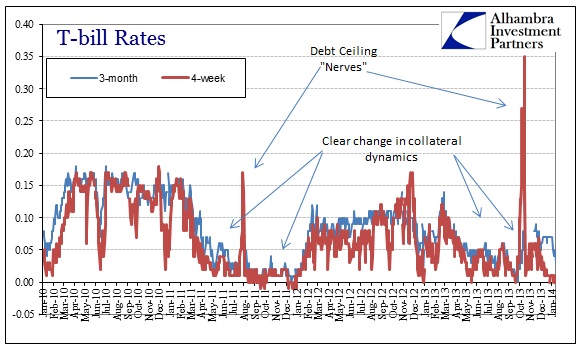
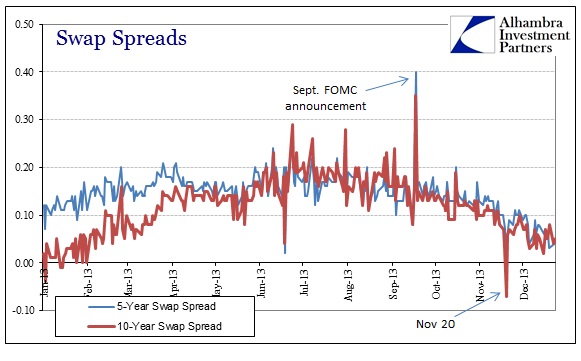
Where there was some avoidance in t-bills by money market funds concerned over even the smallest possibility of default or delayed repayment, by and large t-bill rates sunk in that period. That continued a trend established earlier in the year as I have chronicled at length, connecting various funding markets (including swaps). What was most curious in early 2013 was that bill yields began to fall in concert with swap spreads widening (and in the 10-year maturity, moving back above zero) but little else (more on this in a moment).
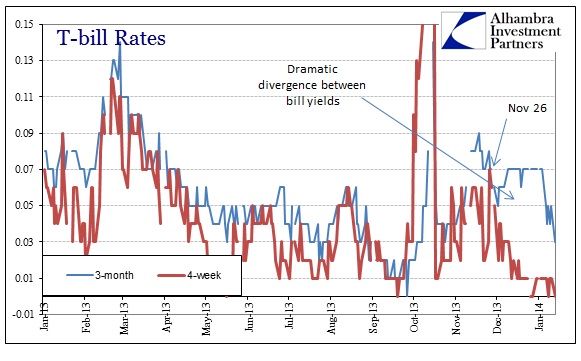
In this latest move, t-bills at the shortest end of the curve started to move lower in late November (recent high on November 26).
Stepping back, it seems easy to connect all this with simple supply and demand. The federal government ran a surplus in December, and has used bill issuance as the variable in its overall borrowing structure. The 4-week bill in particular has seen a dramatic near-dissolution in issuance in December and especially January.
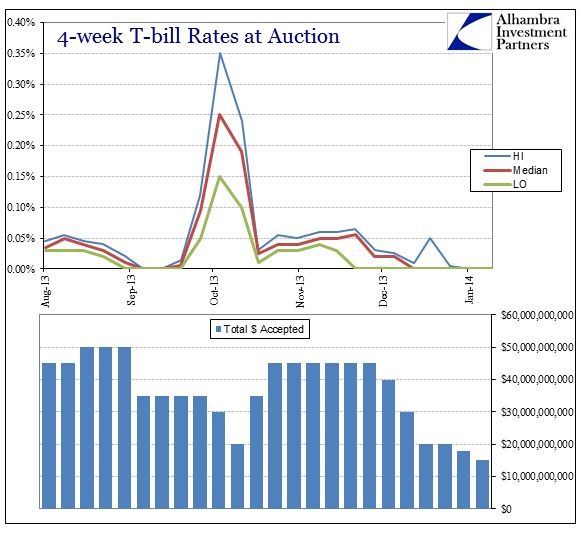
It stands to reason that with the federal government cutting back so much in issuance that rates would fall without any inferred changes in demand for collateral. Furthering that assertion is what we have seen in the auctions for bills closest to the 4-week.
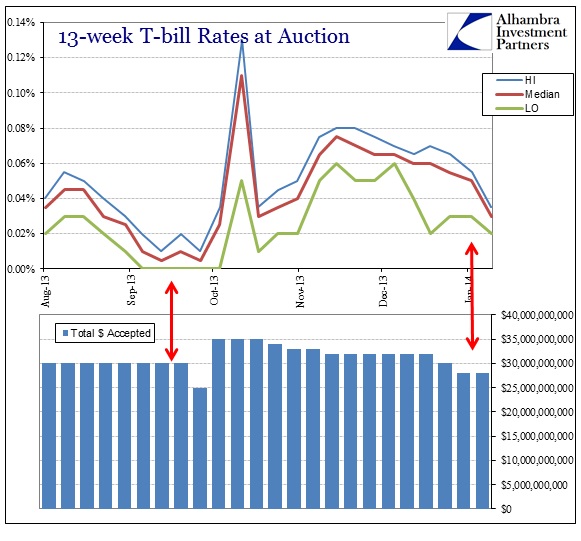
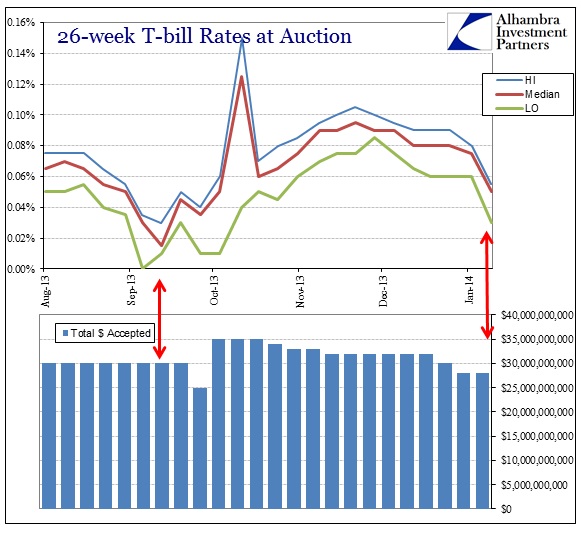
Like September, the decline in 4-week issuance spilled over into auction demand in the other maturities. So the overall decline in bill issuance, mostly concentrated in the 4-week maturity, seems to be the force compelling bill rates back toward and below zero.
The problem I have with that explanation is that it is incomplete. I don’t doubt that supply issues are a major factor here, but there is a curiosity again in terms of timing. If we take a closer look at the 4-week bill auction, we see that the low yield hit zero at the November 26 auction. That was a full two weeks before the treasury began to “taper” bill issuance.
While it is likely funding market agents were aware of the state of the federal budget and anticipated the borrowing pace (treasury auction schedules are not kept secret, after all) there is no real reason for that to affect bill demand ahead of time. As is clear in the chart above, the median and high yield bids did not follow the low bid until the actual decline in issuance levels – which is what you would expect from repo participants.
That would suggest, and strongly so, that there was at least some part of the repo/collateral market desperate for bills in late November, and thus perhaps unrelated to the overall supply issue.
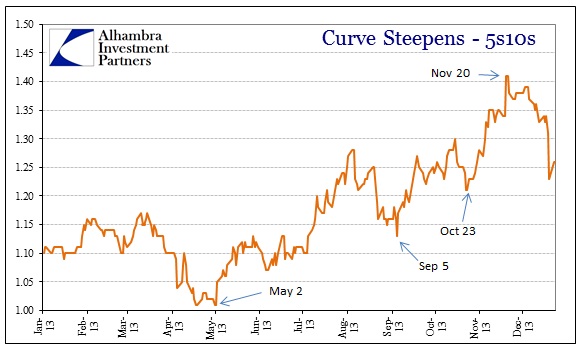
The November 26 bill auctions were the first auctions completed after November 20. That date, like so many inflections in credit markets this year, has shown up in numerous places. The most prominent was certainly the swaps market.
It also marked the high point in the recent yield curve steepening where the longer end sold off more dramatically than the belly. Since November 20, that has flipped.
So how do we tie all these together? First, let me reiterate this is all speculative and circumstantial since these markets are, for the most part, completely dark. But it seems as if my theory about a dealer (or two) getting stuck in the wrong trades in swaps and rate markets may be correct. These are additional hints that a major funding problem was occurring hidden beneath the larger trends of more obvious indications.
What is most intriguing about this, if my interpretation is anywhere near close to reality, is that this is exactly how markets begin to break down. Going back to August 9, 2007, for example, it took more than a year for dramatic problems that day to turn into full-blown panic; with numerous and often confusing and contradictory ebbs and flows in between. But that is the pathology of crisis – where leveraged positions built under the previous regime take time to become unwound, and often disorderly in nature. The taper-talk selloff of the middle of 2013 appears to have been a complete paradigm shift in credit and funding markets. The anomalies of November, like the behavior in gold, hints at exactly that though, like 2007-08, it is mostly hidden in the recesses of balance sheet modeling. This is not to say that there is an impending 2008-style panic, only that dollar and credit markets appear to be in a state of criticality that is heading toward its phase shift.
The other major point here is the impact of QE on all these markets. What I mean by that is separate from tapering the pace, but rather the ZIRP aspect. With rates already so low across the spectrum and idle cash in numerous places there is little room for error. I think that was the full intent of the reverse repo program – not so much about removing reserves in anticipation of QE withdrawal (reserves are, by definition, already removed) but in trying to enforce a hard lower bound or floor in various interest rates. Theoretically that should have an impact in the repo markets, including the rate at which collateral can trade, but theory does not (ever?) match reality as the actual market structure often differs from theory and morphs in practice.
This is all very interesting and bears additional scrutiny. Clearly the interest rate curve, at the very least, has been impacted significantly.
Click here to sign up for our free weekly e-newsletter.
“Wealth preservation and accumulation through thoughtful investing.”
For information on Alhambra Investment Partners’ money management services and global portfolio approach to capital preservation, contact us at: jhudak@4kb.d43.myftpupload.com
Stay In Touch