
For the sake of concision, I think it best to divide the observations about the labor market, folding in Friday’s report, into their natural constituencies of trend and cycle. This post will handle the cyclical aspects of the most recent payroll observations.
My ongoing theme since October 2012 has been the noticeable divergence between the Household Survey and the Establishment Survey. More recently, the two estimates have actually converged, owing largely to a rebound in the Household Survey next to sluggish Establishment calculations, but only to a relatively minor degree. Given that the Household Survey’s results have been markedly improved since December, that speaks a great deal about just how far apart (and thus underwhelming) payroll estimates remain.
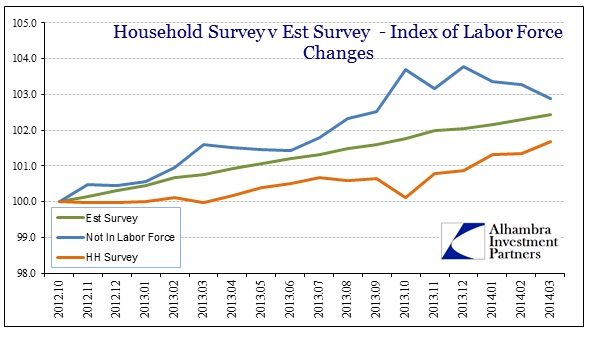
Add to that mix a sharp upswing in the labor force participation and the recipe is one of confusion.
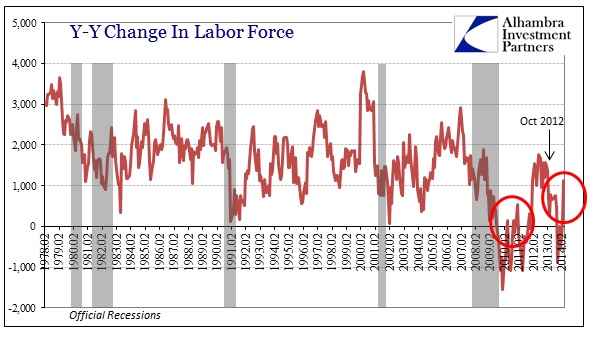
The only evidently applicable context in history for this labor force behavior is the 2009-10 rebound/trough as the estimations of the labor force appeared to vacillate violently as the economy began to emerge from tremendous contraction. That would seem to add weight to an optimistic view of economic conditions, except that there is no corroboration anywhere. Growth rates in almost every economic account are at fractions of what they were in the last few months of 2009 and into 2010, so I find it difficult to accept that view.
However, taking a wider gaze, the latter part of 2007 also offers similarities, and of a far broader nature. As I mentioned with last month’s payroll data, the divergence between the Household Survey and the Establishment Survey appeared then as well.
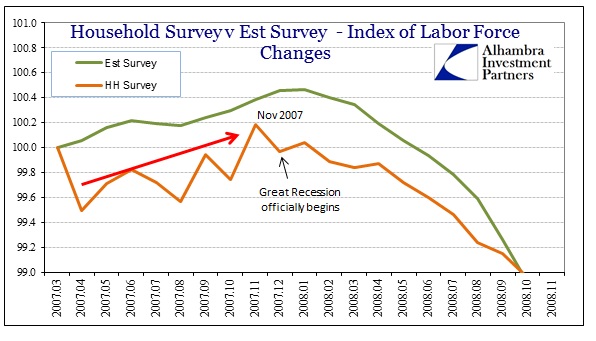
There was a clear initial “shock” in the early months of 2007 (that proved quite prescient) in the Household Survey before that measure resumed its upward move. The two even came close to full convergence in November 2007, before it all fell apart. There was also a rebound in the labor force as the calendar turned to 2008.
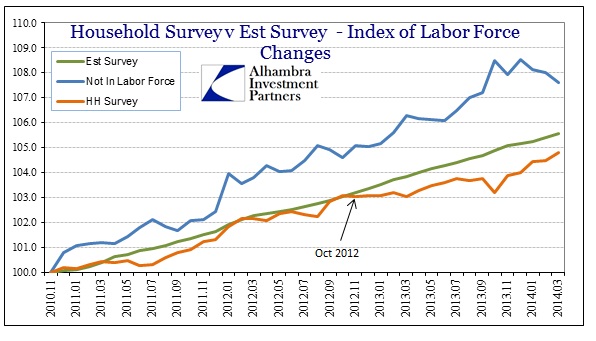
The similarities do not end there. Economists prefer (by a wide margin) the heavily adjusted and sanitized Establishment Survey because they assume it offers a less volatile, and thus more accurate, sense of labor conditions. There can be no doubt about the lack of volatility, as the Establishment Survey shown above courses an almost exact straight line, as if economists (statisticians) at the BLS simply used a ruler in charting the expected course of payrolls.
As ludicrous as that may sound, the BLS actually performs something very similar. Owing to trend-cycle analysis of variation, the monthly release of the Establishment Survey only really measures assumed variance around a pre-determined trend (benchmark). What would happen if the assumed and presumed benchmark (based largely on trend and cycle estimations) was even partially inappropriate? I think that is what the former director of the BLS was trying to say last summer, that they have little idea how to benchmark in the current economic climate.
Only somewhat in jest, you can draw a straight line and see that the Establishment Survey has followed such a path with very little deviation, particularly since October 2012.
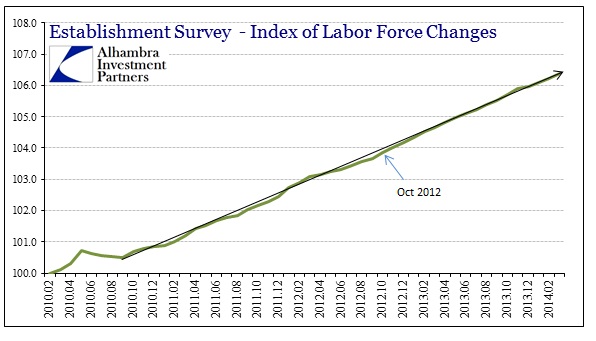
Since then, there has been exceedingly little variance in the monthly measures of the Establishment Survey. If you compare that result with the last “recovery”, it is both curiously contrasting and confirming.
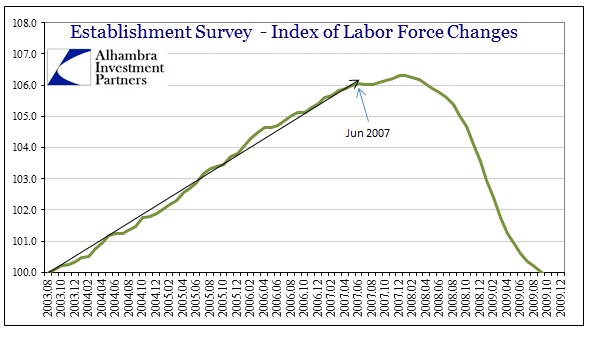
The contrasting portion is that before late 2006. There was far more variance in the monthly measures from the employment trough in 2003 until the top of the housing bubble. Then, as if something radically shifted, the Establishment Survey lost nearly all of its previous variance, and from then until the middle of 2007 it followed the straight line path.
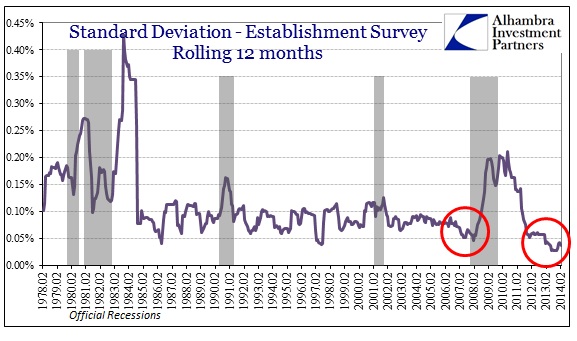
This is not some optical illusion either, as we can see it very evidently in a graphical representation of the standard deviation (rolling 12 months).
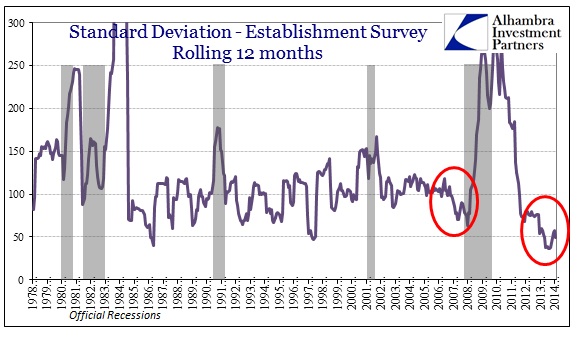
The variance in the monthly measures of the Establishment Survey has only been this low on two previous occasions since the 1970’s – the near recessions of 1986 and 1997-98. The current run of historically low variance (the straight line benchmark) has continued far past anything seen in the historical data.
It does confirm the observation about late 2006 and early to mid-2007. For some unspecified reason, the variance in the survey calculations conformed to a straight line trend just before the onset of the Great Recession. And it lay exactly within the period between the top of the housing bubble and the economic consequences of that peak imbalance.
There are a couple of potential interpretations here, the most basic of which pertains to these kinds of statistics and their situation in any cycle. In other words, it seems to suggest that there is some kind of reinforcing bias whenever the “economy” shifts away from the script, which might explain why the low variance has persisted for years in the current case. The logical extension of that interpretation is that these statistics become increasingly unreliable the closer we get to inflections, or changes in the cycle.
That makes intuitive sense when you factor the trend-cycle construction. It does not, however, offer an easy explanation for why we see this narrow variance channel (why not a wider channel?).
There are some further explanations that hold potential to add value to this analysis, but they veer far, far afield into non-linear mathematics and fractals.
The short version is that the Establishment Survey is behaving strangely and thus may not be as reliable as believed (on a simple common sense basis, is it likely that the dynamic, if still depressed, jobs market is behaving in straight line fashion?). Because that apparent noisiness seems to occur around cyclical destabilization (scale invariance) it would suggest that the downstream observations of the labor market are far more of an unknown than typically presented.
Click here to sign up for our free weekly e-newsletter.
“Wealth preservation and accumulation through thoughtful investing.”
For information on Alhambra Investment Partners’ money management services and global portfolio approach to capital preservation, contact us at: jhudak@4kb.d43.myftpupload.com
Stay In Touch