
I spend a lot of my time analyzing these various economic accounts with the idea of flawed statistical inference never far out of awareness. The government agencies themselves spend a great deal of their effort in the same way. Ever since these accounts were “converted” to probability models, statistics is an important part of the “reliability” factor that nobody actually seems to be aware exists. This is true for nearly every data series.
One way to overcome this weakness is corroboration. If modeled results from the Establishment Survey imply a strengthening economy, I tend to take that with a grain of salt the size of its unusually narrow confidence interval. In other words, by itself the Establishment Survey may be suggesting something but that should be by no means definitive. If it is indeed capturing an upward trend, that should be correlated with other various data series to minimize the chances of bad math intruding on implications.
The BLS itself cautions, somewhat, interpretations on the month-to-month changes in the data. Under the “reliability” heading, they note:
For example, the confidence interval for the monthly change in total nonfarm employment from the establishment survey is on the order of plus or minus 90,000.Suppose the estimate of nonfarm employment increases by 50,000 from one month to the next. The 90-percent confidence interval on the monthly change would range from -40,000 to +140,000 (50,000 +/- 90,000). These figures do not mean that the sample results are off by these magnitudes, but rather that there is about a 90-percent chance that the true over-the-month change lies within this interval. Since this range includes values of less than zero, we could not say with confidence that nonfarm employment had, in fact, increased that month. If, however, the reported nonfarm employment rise was 250,000, then all of the values within the 90- percent confidence interval would be greater than zero. In this case, it is likely (at least a 90-percent chance) that nonfarm employment had, in fact, risen that month. At an unemployment rate of around 6.0 percent, the 90-percent confidence interval for the monthly change in unemployment as measured by the household survey is about +/- 300,000, and for the monthly change in the unemployment rate it is about +/- 0.2 percentage point.
A couple of items are interesting/important here. First, the idea of the confidence interval isn’t exactly as stated above, that “there is about a 90-percent change that the true over-the-month change lies within this interval.” Actually, all the confidence interval purportedly tells us is that if the BLS ran the same exact sampling process 10 additional times, 9 of them would have a mean that falls within the estimated range of +/- 90,000. One of those additional samples would not.
So why not use instead a 95 or 98 percent confidence interval? After all, in most cases a 95 percent confidence interval is standard, particularly in hypothesis testing. The reason the BLS stays at the 90 percent interval is that a 95 percent confidence interval would produce a range that is so wide as to be almost meaningless toward what they are trying to actually measure.
Take the confidence interval on the Household Survey and apply it to this month’s rather “robust” sample mean. The BLS estimates that June saw 407k new employees, but in reality what they are saying is that if they ran an additional 10 samples, in 9 of them the measured change would be somewhere between 107k and 707k – and one sample would have a result outside that range entirely. That is one reason why the Household Survey is almost ignored by statisticians (economists).
But the same applies to a lesser degree to the Establishment Survey. The purported estimate of 287k for June, given the “reliability” of the current estimate (and even the reliability is only estimated, and will be revised like everything else) at a 90 percent confidence interval, if the BLS engages in another 10 survey samples of the same construction, 9 of them will show a mean somewhere between 197k and 377k – and, again, one will show a mean totally outside the range. If they had indeed run the samples again and it came in with 200k, it would still be within the range but it would completely change the perspective on payrolls in June.
Do that several months in a row and you can drastically alter the perceptions of payroll growth while still maintaining statistical “validity.”
This would be even more exaggerated at a truer 95 percent confidence interval. That is why I do not accept the blanket statement of the Establishment Survey without validation from other indications. That starts with the Household Survey. Over time, the statistical “reliability” of the month-to-month changes fade as more data accumulates (unless benchmark revisions are needed, which is a whole other topic and discussion) meaning that over time there should be agreement between them on more than the general direction of the labor market.
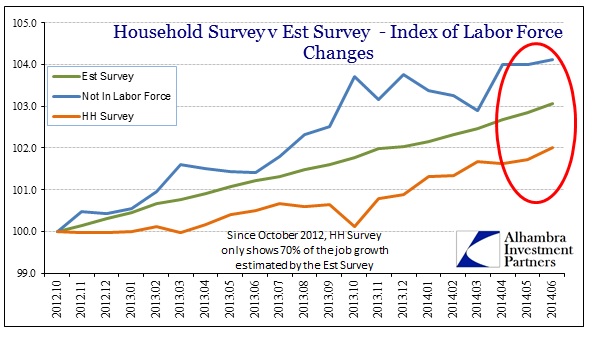
The divergence between the two surveys has only grown over time. Since they separated in October 2012, the Household Survey has shown only 70% of the job growth figured by its cousin. As a starting point, that only adds to the unease of using the Establishment Survey as a basis for understanding labor changes, and thus the economy.
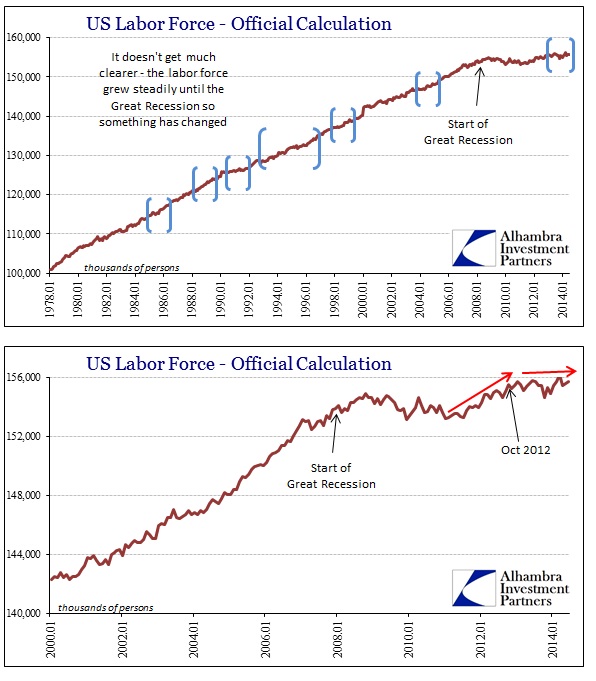
But it gets downright discarding once you move into the labor force itself. There has been zero growth, not just recently, but for going on two years. The total official labor force (in the tortured 21st century edition) has not changed at all since the start of 2013, and is only 187k more than October 2012 (essentially flat). I keep seeing a persistent appeal to population growth as an explanation for it, but it just doesn’t wash.
This is not to say that the population hasn’t downshifted; according the population figures the civilian non-institutional population has grown far more slowly in 2013 and 2014 than 2012. But in prior periods where population growth was equal or even slower to now the labor force had absolutely no trouble with expansion.
I have marked in blue brackets above where population growth was the same as 2013-14. In case it wasn’t fully clear from just that, the figures bear out that population is not the primary variable explaining labor force changes.
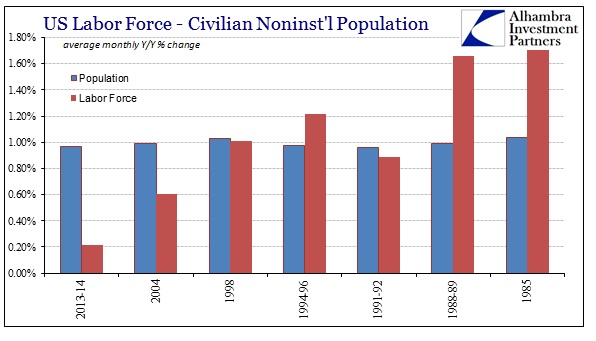
Clearly there is little correlation between the population and labor force at the margins. Viewed chronologically, that leaves little doubt that there is a heavy economic factor in determining changes in the labor force.
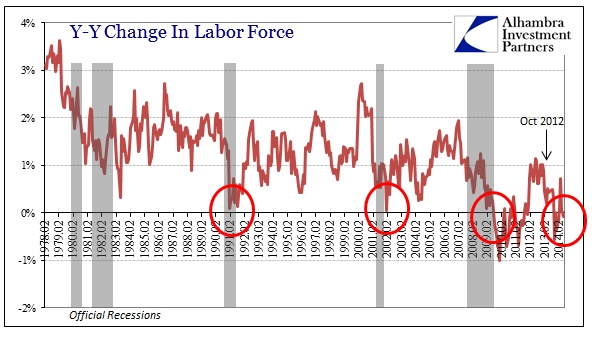
For the second time since the middle of last year, when the economy clearly started decelerating into a disastrous start to 2014, the labor force is below its prior year level. Such shrinkage is highly irregular and has only been associated with the opposite of what the Establishment Survey shows. The fact that this has persisted for so long now argues for something more than temporary.
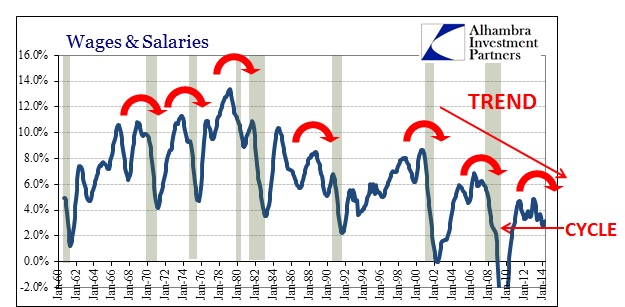
I find it increasingly difficult to see a strong labor market failing to entice new entrants to seek work, and to fail to do so in such spectacular fashion. Further corroboration of that fact is seen in the income estimates, which do not look at all like a robust improvement (more on that to come). Orthodox economists can reference labor “slack” as a condition for keeping earnings down, but the truth is that income growth was actually higher when supposed slack was greater. As the Establishment Survey and unemployment rate imply less slack, income growth falters?
There are far too many indications arguing against the Establishment Survey. It is alone in a sea of malaise and disrepair that should not exist if payrolls were actually growing as strongly as the mainstream interpretations of them. I see instead a statistical mirage, an inequality in the equations.
Click here to sign up for our free weekly e-newsletter.
“Wealth preservation and accumulation through thoughtful investing.”
For information on Alhambra Investment Partners’ money management services and global portfolio approach to capital preservation, contact us at: jhudak@4kb.d43.myftpupload.com
Stay In Touch