
Checking the eurodollar curve shows that it does indeed appear as if the July-September trends are back in place. The dominant theme was for shorter maturities to be “tight” while the general eurodollar curve grew flatter out past some (dynamic) “attachment” point where the monetary policy window ended. That threw together a few important variables, including estimates of potential rate hikes and how high they may eventually get, and, perhaps more importantly, how damaging they may ultimately be (flattening).
This tight/flat trend took a breather at the end of September, if only for a few weeks reprieve in downstream markets (gold, Brazil, Russia, etc.). Since mid-October, even before the FOMC’s latest faux “hawkish” stance, the curve moved back to the tight/flat again that was mimicked not just in appearance of the curve movements but in the relatively small degrees to which each segment was carried out.
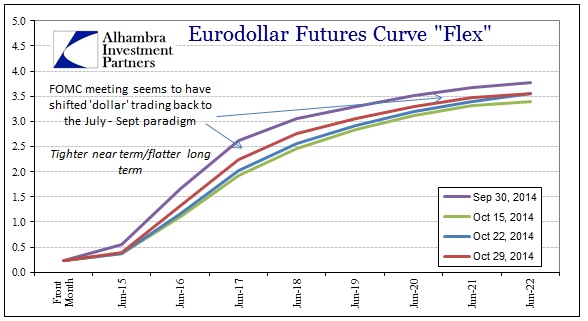
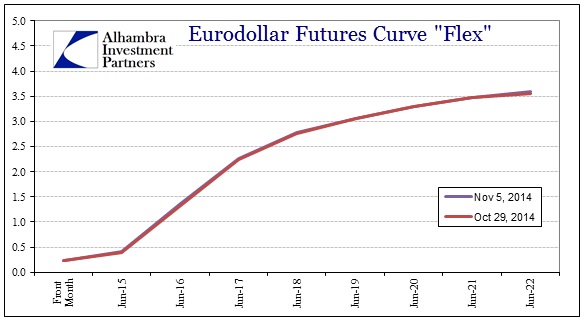
So far in November, that remains the case though it is difficult to see it below since the changes are so very slight – tighter short (June 2016 +3.5 bps) and flatter long (June 2021 +1 bp).
That seems to be the favored hedge position too, as swap spreads continue to suggest a bias toward hedging against the end of ZIRP if only in slight and discrete positioning.
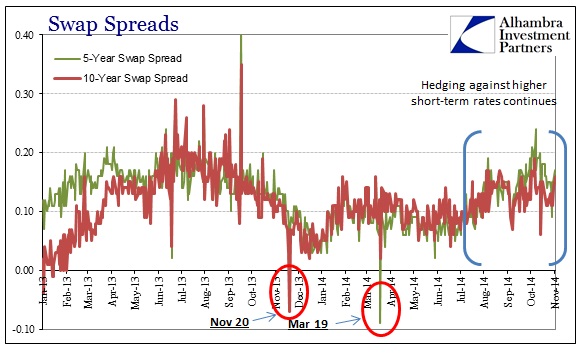
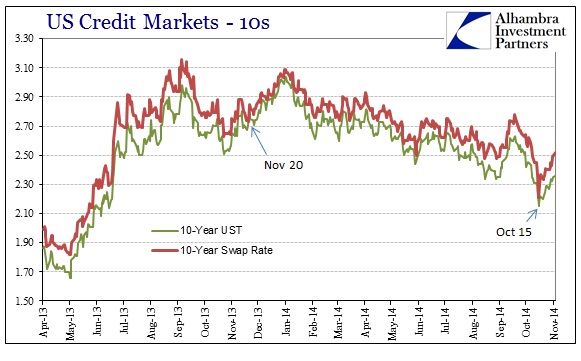
What sticks out prior to the “dollar” tightening episode are the spread “anomalies” on March 19 of this year and November 20 of last year. I have covered November 20 numerous times before and still have no better idea what happened now than shortly thereafter. My sense is still that some dealer(s) was(were) being hit with too many collateral calls for being positioned for unending QE; thus the sharp steepening that occurred from May 2, 2013, until then in the UST curve was a very bad place for this/these dealer(s).
Undoubtedly, with swaps positions moving more and more in the “wrong” direction, collateral would have had to have reversed the favorable trend that dominated from QE3’s announcement until then: if dealers were receiving on IR swaps, and negative spreads right after QE3 was announced suggests as much, they were also receiving positive collateral “calls” as the values of those contracts continued in the floating direction; when that all reversed beginning with the first taper threat on May 2, 2013, collateral no longer flowed to dealers instead back to their counterparties (starting off as less positive collateral flow to dealers, then neutral collateral flow until eventually, at some point, collateral would reverse and go from dealers to counterparties). That wasn’t a major problem, apparently, until the sharpness of the yield curve’s steepening became too much to bear, and thus there was likely no risk absorption left systemically (another form of liquidity impairment) and these positions reached a critical point.
That appears to have been November 20, and I still believe that the FOMC buying heavily in the 9- and 10-year through POMO (scheduled or not, they still had enough leeway in how much they could buy and at what specific securities) was as much a backdoor bailout on those poisonous positions.
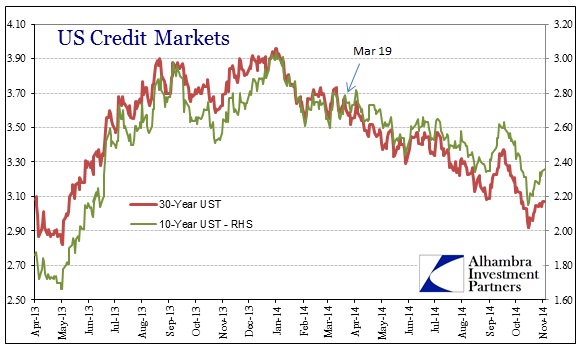
It was also November 20, coincidentally, where the entire yield curve stopped steepening and started its now almost-full year flattening trend. The flatter UST curve received quite the boost on March 19, 2014, via Janet Yellen’s first press conference following an FOMC meeting. “Markets” took her meaning to be a threat not just to QE (which she proclaimed finished by fall; which has turned out) but even to ZIRP (she mentioned that rate hikes could begin in “early” 2015).
So the imprints of November 20 and March 19 are very clear not just in the swaps market but also the UST yield curve.
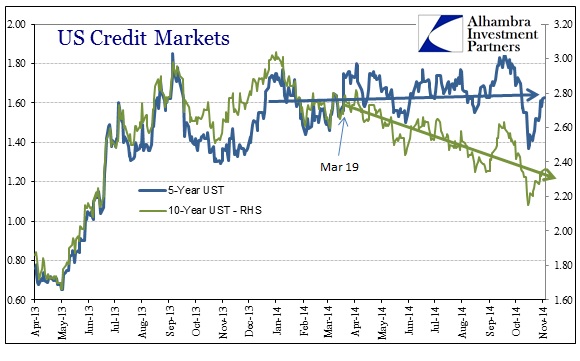
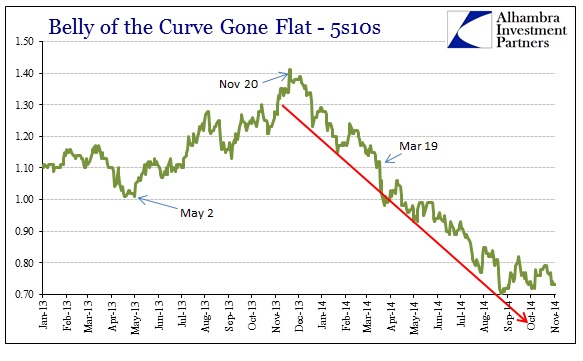
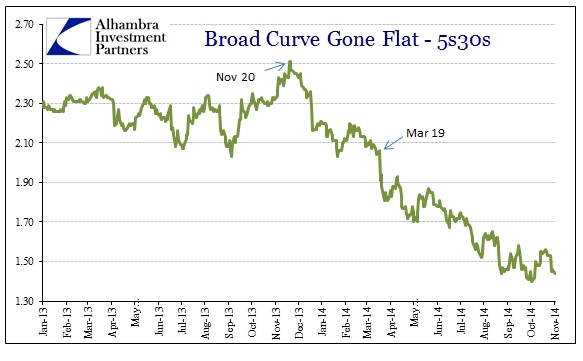
While that all seems perfectly consistent, even if what happened on November 20 was mere coincidence, it is diametrically opposed to the first stage that ignited all of this to begin with. In other words, something drastically changed between May 2, 2013, and March 19, 2014, because for all intents and purposes the same thing happened and produced the exact opposite results.
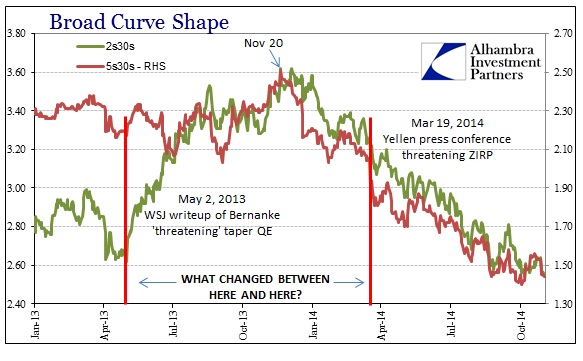
When taper was first threatened, via WSJ, the credit “market’s” response was much steeper with higher (rising quite fast) nominal interest rates. Almost a year later, when Yellen threatened ZIRP, the response was much flatter (quickly) with lower nominal interest rates in general. Perhaps there is a difference in factoring between ending QE and ending ZIRP, but to my mind one follows the other so they should have amounted to much the same interpretation in theory as in fact.
There are a couple of reasons for the very different reactions, including whatever happened on November 20 that may have soured basic opinions on the actual ability of the Fed to exit “emergency” measures. It would seem logical if there were indeed problems or anomalies with dealers that the rest of the “market”, at least those paying close attention, would become quite pessimistic about that “exit.”
That was also the period where economic growth became most threatened, GDP and the Establishment Survey aside, when retail sales had their worst holiday season since 2009 and then snow and winter “somehow” knocked the world’s largest economy into a tailspin. That would seem to reinforce such pessimism about the “exit” as well as overall efficacy of QE and monetarism in the first place.
Finally, I think we have to also account for systemic liquidity. If my interpretations are correct, then that would represent another waypoint in the erosion of systemic liquidity, and maybe even a severe one at that. You can probably draw a straight line between November 20, 2013, and what happened to swaps dealers (who are the same as UST and corporate credit dealers; liquidity “providers” are not separate and their incestuousness leads to these kinds of grand issues), all the way to October 15, 2014, and the massive collateral problem that nearly resulted in an “offerless” UST market (supposedly the most liquid place on the Fed’s green financialized earth).
What this all tells me is that in the middle of 2013 credit markets were idealized and enthralled that the Fed had engineered what it long sought, both a stable recovery and an exit path. The treasury curve grew steeper and interest rates rose including eurodollars. Almost immediately that ran global problems before clogging up even domestic liquidity. What looked like a stable recovery and exit path turned very quickly into an unstable economy and nothing but problems upon even mentioning exit. In short, to use the refrain once more, they don’t really know what they are doing. So the difference between 2013 and 2014 is that credit markets, including globally, now know it.
Stay In Touch