
Part 1, with the introductory framework, is here.
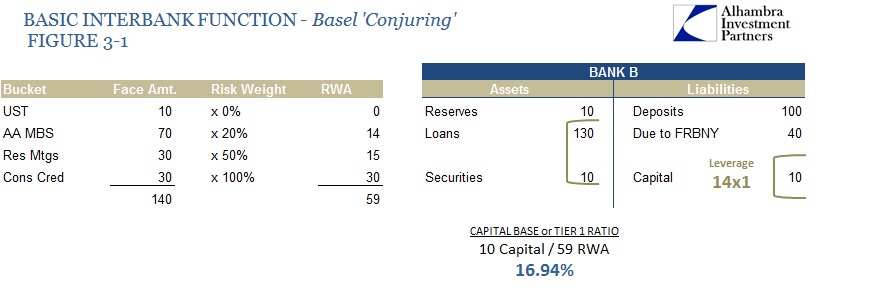
Prior to the crisis, the Basel rules “allowed” (if not downright encouraged since it was bankers that really wrote the rules through regulatory proxies) bank assets to be divided into “buckets” in order to calculate reserve ratios. The entire premise of reserve ratios, Tier 1 capital and all that, was to measure how much margin for safety a bank embedded in its balance sheet by comparing “capital” against the likely adverse effects of each bucket. In other words, sovereign debt was given a ZERO risk weight, which meant that sovereign debt was believed and calculated as risk-free. So holding UST, for example, meant a greater capital ratio than holding an equal par amount of AA-rated MBS.
Now it was the AA-rated MBS that was the primary problem (including some AAA-rated suffered rather severe illiquid pricing, though none ever experienced an actual dollar loss). The Basel Rules allowed banks to risk-weight them at 20%, which followed from historical data about expected defaults and recovery rates, flowing through the black box calculations of ratings agencies. Of course, AA-rated MBS in 2005 was far different than AA-rated MBS of historical record, so pricing problems started and grew in what was thought to be a “low risk” bucket, weighted according to those mistaken assumptions (a general theme).
If we take the Bank B view of “Loans” from the post-QE point and assign all $130 to various buckets, the real limitations of banking post-crisis become quite clear. I have assumed a $70 proportion of AA-rated MBS which is probably low in comparison to allocation of the larger banks during the crisis (though, again, that would include AAA-rated and super senior tranches which were of the greatest par volume).
As MBS securities received both ratings and pricing disfavor, they were marked different “forcing” banks to “eat” the capital changes on their balance sheets and in their capital ratios (in reality, banks could not afford this process so they fire-saled a lot of it anyway despite the “liquidity rescue” by the Fed; again, central banks not fully understanding all the implications of the very system they were charged with “regulating” and limiting).
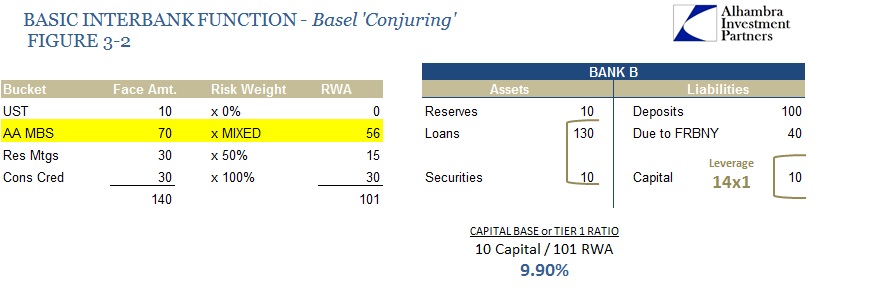
Just assuming a mix of ratings downgrades for the AA MBS pieces, the net result I have mapped here is for Risk Weighted Assets (RWA) to rise from $59 in Figure 3-1 to $101 in Figure 3-2. Nothing changed in regard to par values or cash transactions, as simply ratings downgrades that effected the “bucket” crippled capital ratios (this includes the “value” changes of hedging offsets). So Bank B thought it had a sufficient capital ratio of about 17% to start with because of that rigid “bucket” classification, suddenly revealed as only 9.9% (and likely worse) without doing anything.
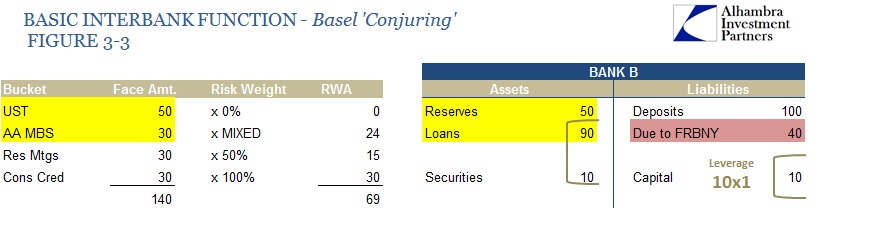
Belatedly, QE1 sought to take some of that pressure off bank “capital” (as did FAS 157 which shook off mark-to-market) by allowing Bank B to “sell” MBS to the Fed at the proverbial undue premium. The net effect of that, shown here as $40, was for Bank B’s assets to change $40 from “Loans” to “Reserves” (similar but not exactly the same to what had been done for Bank A in Figure 1-2). Note that Bank B’s original liability to FRBNY does not change as that related to the interbank market (other liquidity-based emergency measures) rather than this QE-type transaction.
At this point, reserves have risen at Bank B, which the inflationists fretted over endlessly. However, the capital ratios were the primary limitation which meant that Bank B (and all the other Bank B’s out there, which were essentially all the big banks across the global dollar short, especially the US and Europe) never had much by way of options for additional lending of those newly created “reserves.”
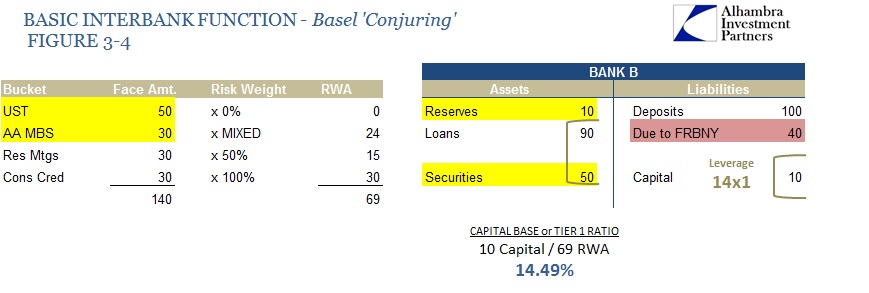
If Bank B took that $40 from QE and invested in UST, its capital ratio suddenly rises back to about 14.5%. In reality, that was the only real path for any of the globe’s Bank B’s, especially Europe where sovereign debt even denominated in euros.
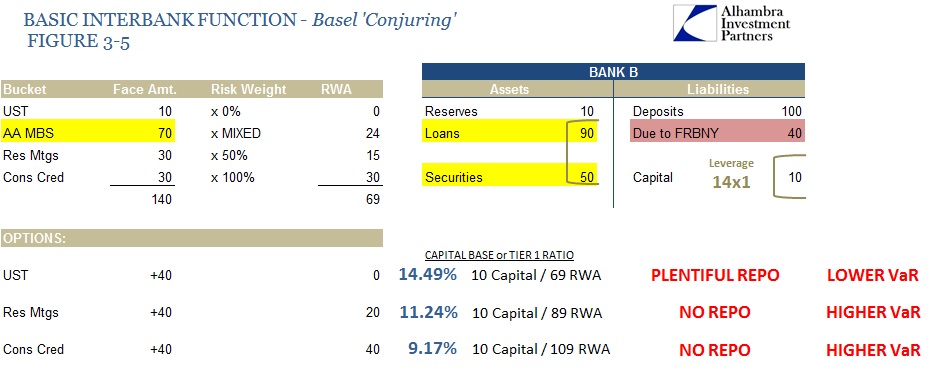
That brings up the last complication that nobody seems to appreciate; that this “choice” of financialism in the post-crisis period has been no choice at all unrelated to bank “reserves.” If Bank B lent that $40 in the form of either new mortgages (no way that was going to happen anyway during the housing crash) or consumer credit, the capital charge of the risk-weights was far too expensive. The only way to “rebuild” capital ratios was to first invest in sovereign debt to help initially with the ratio calculation and then the “easy” earnings of that debt to flow through the income statement and into retained earnings (which is the largest component of bank “capital”).
In Europe, that was made all the more “valuable” as PIIGS debt was still given the ZERO RWA but yielded a significant premium over UST or German bunds. From 2009 into 2010, banks loaded up on PIIGS for these very reasons – with absolutely no possibility that this transformed credit apparatus was going to flow to individual loans to people or small businesses. That was again repeated after July 2012 as European banks suddenly could pocket both the ZERO RWA and the tremendous price discount to which PIIGS debt was then “trading” – all of which further “helped” capital ratios and, with the ECB bending collateral rules, liquidity management as the ECB like the Fed in 2009 basically took over the interbank repo market in euro-denominated sovereigns.
That statement includes the fact that there were/are other liquidity constraints to all of this too. Sovereign debt, including PIIGS, prior to 2010 were eminently repo-able and contained a much lower VaR component. For a bank that is trying to rebuild its “capital” base, those were the primary factors. Other forms of lending simply offered.offer no repo possibilities and higher VaR scores.
That has not changed at all, especially in Europe. That is why the ECB has repeatedly in the past two years lowered the collateral rules to allow ABS and other “loan products” to receive the same liquidity characteristics (or as close as possible) as sovereign debt. And that also explains why the ECB “had” to “do whatever it takes” to get sovereign debt markets back to “normal” since banks were getting hammered again on VaR and repo illiquidity – out of the MBS frying pan and into the PIIGS fire.
The other part of that is the liquidity system as it exists right now, which is an outgrowth of all of this. In other words, collateral placement and flow is totally different now than it was in 2007. The Fed proclaims that it has been fixed and everything is fine, “resilient” even; recent indications prove otherwise. That includes what the ECB is doing now, as it is, as I stated at the outset of Part 1, fully related to that deficiency. I will expand on that topic at a later time in Part 3.
Stay In Touch