
The FOMC has been talking, so we hear, about changing “forward guidance” to indicate a potential rate hike sooner rather than later. They had already changed the basis of “forward guidance” back in September which largely negated what forward guidance actually meant. The concept is only pliable in the manner in which monetary theory has to follow “rational expectations.”
Whenever I get to discussing “rational expectations theory” the typical response I get is one mostly of disbelief, as in whatever and wherever the theory is applied seems somehow offend basic common sense and intuitive sensibilities. I don’t disagree at all, as I am not one to subscribe to theory only observing how it fits within the paradigm of monetary economics – you don’t have to agree with it but you better understand it so you can better analyze why the Fed does what it does.
The reason “rational expectations” grates so much upon basic observations is that it is a symptom of orthodox economics’ dominating tendency to make reality fit its models. In other words, “rational expectations” is nothing more than a mathematical variable in a set of equations designed to generate a “generalized equilibrium.” Yet another way of thinking about it is that the math is so narrowly defined and construed “rational expectations” is the means solely by which the equations are solvable without disqualifying infinities.
Since the math works under these assumptions, economists have set out to define their view of the real world to match the math, which is why it often sounds, essentially, ludicrous. Among those “fitted” properties is market efficiency. Rational expectations essentially forces markets to be perfectly efficient to keep the paradigm logically consistent – all market prices are thus assumed, because of this math, to be correct. That would further contend there are no asset bubbles, and so orthodox monetarism may only accept rational expectation or asset bubbles, but not both.
“Forward guidance” in its Bernanke incarnation was a similarly ridiculous idea that conformed to perfect market efficiency. Rather than exist as a means of simply communicating a rate hike, what forward guidance especially at QE3 meant was that if QE was believed to work then it could never work (again, devolving monetary theory into circular reasoning). Since markets are believed perfectly efficient, following from rational expectations math, then market behavior would adjust immediately upon the introduction of QE3 (or any of them) to thwart QE’s intentions – QE was intended to reduce term premiums (another of these math topics which I’ll save for another day), but market efficiency would instead lead to higher interest rates because investors would be preparing for the period in which QE had worked (past tense).
Essentially, Bernanke manipulated the financial factors to override the “market’s” desire to discount information. By establishing an unemployment threshold, then 6.5%, he could use the “market’s” desire to scalp profits by frontrunning actual QE operations against itself. Therefore, the primary consideration would be placed on QE-buying rather than the eventual success of QE in the economy and toward “inflation.” I think there is no doubt this was expressed in credit markets, especially TIPS and inflation breakevens during that fourteen month period where they went “dark.”
In that important sense, the purpose of “forward guidance” was to shift perfect efficiency from economic fundamentals to financial arbitrage, but doing it in a way that did not disrupt “rational expectations” as an overarching theory. Lower interest rates typically do not associate with better economic conditions, especially term premiums, which would, under perfect market efficiency, mean that QE had actually failed if the market followed what QE wanted to accomplish. So “forward guidance”, as preposterous as it sounds, covers both ends of the QE dynamic so that rational expectations, perfect market efficiency and all that can be maintained. The real world is fitted to the equations.
We already know very well how this has already fallen apart, as term premiums (whatever they may actually mean in the real world) and the yield curve has flattened tremendously ever since November 20, 2013. That would seem to reflect the opposite of all those opposites associated with Bernanke’s version of forward guidance I described above. In other words, if Janet Yellen and the FOMC actually believe in “rational expectations”, and they have to or else every single econometric model is rendered moot and irrelevant, then perfect market efficiency says QE was a complete and total failure.
Not only that, it would also indicate, along with credit market behavior last decade, that there are, in fact, asset bubbles. The temporary explanation back in 2005 to get around this problem was Greenspan’s “conundrum” academically boosted by Bernanke’s “global savings glut.” The mathematics of rational expectations, derived back in 1972 (actually 1970, but his paper wasn’t accepted and published until later) by Robert Lucas, means that any deviation in “markets” and asset prices, in particular, can be nothing but random.
Actually, more specific to statistics theory, the probability of deviation is no greater than random chance. To preserve rational expectations means viewing asset bubbles as being no more probable than random chance.
That is quite a problem in 2015 since there is less and less randomness about them; to the point they can be described as serial occurrences. Anything that occurs with regularity is, axiomatically, non-random and therefore should move, even in the math, from the “error” terms to become a measured and accounted variable. Fortunately, we don’t need to embark upon a great statistical quest to find such an explanatory deliverance, everything about serial bubbles points in one direction and one direction alone. Further, this “random” “error” is something that econometrics does not control, observe or even bother to understand, which is why it has lasted so long as a mystery to monetary authorities all over the world.
If you simply look at asset markets, there is no doubt as to when “it” all began.
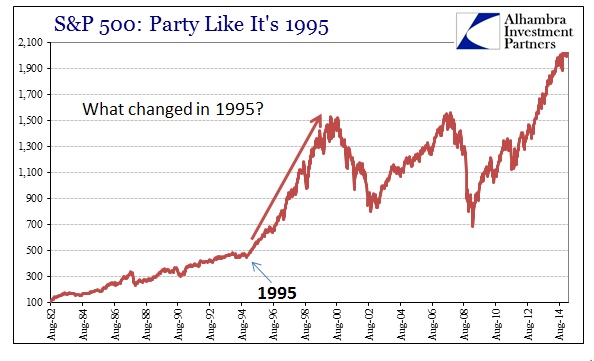
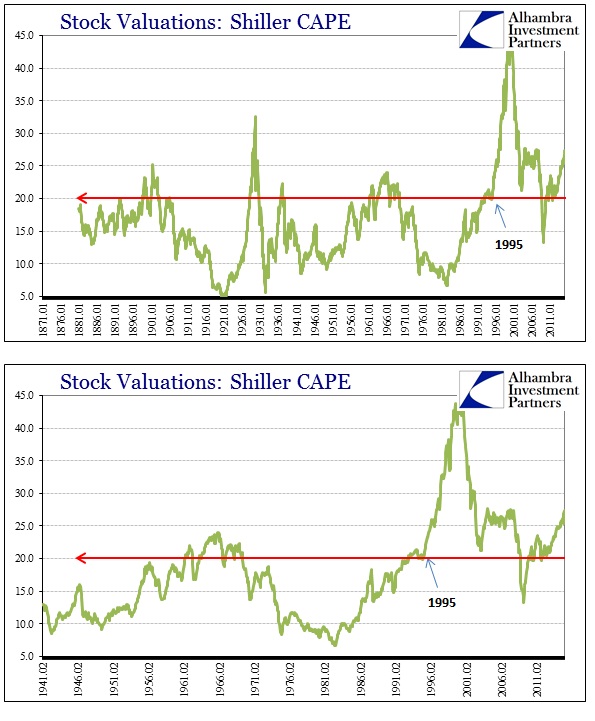
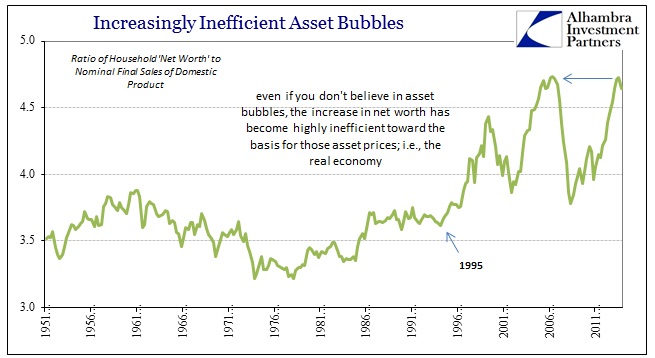
The S&P 500, along with all the other major stock indices, “found” a new level of rise starting around 1995. That included more than just raw asset prices as valuations also surged at that moment, meaning that this was not a fundamental change to the underlying economy or corporate systemic function.
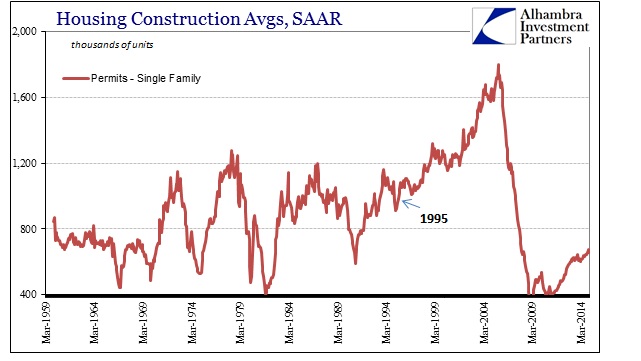
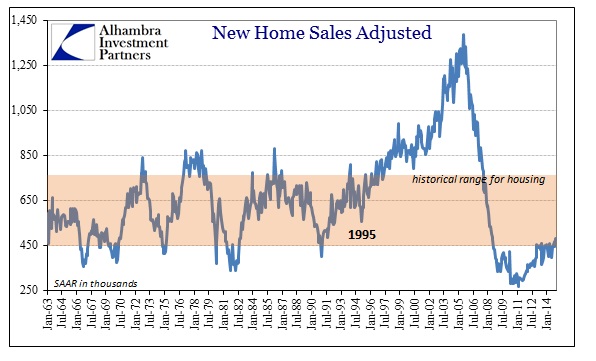
At almost the same moment, housing construction and sales followed the exact same pattern. By 1996 or 1997, housing activity, including prices, simply escaped all prior historical experience. If there were a sudden population surge, which would have been known decades in advance, that would offer a “market efficiency” explanation but instead housing seemed to simply follow or parallel stock prices (with a lag as construction takes time to manifest from any financial increase).
Indeed, looking at asset prices as a whole through the lens of household net worth, the relation of financial assets and home “values” seriously diverged from any economic foundation right at 1995. Again, that would more than strongly imply prices rather than basis.
Knowing what we know of not just bubbles but more importantly how they end, our experience in 2008 forces consideration immediately upon the rise of the shadow banking system – and with good reason. The increase in short-term rollovers and funding away from deposit growth and traditional mechanics certainly contributed to the massive financial imbalances seen here and everywhere, but there is no easily discernable turn in shadow banking at 1995.
In fact, shadow or wholesale banking had been growing rather steadily since the 1970’s. Domestically, federal funds and repos were increasingly the marginal source of expanding bank balance sheets from long before 1995, so it isn’t immediately clear from this perspective as to why bubbles suddenly showed up at that time.
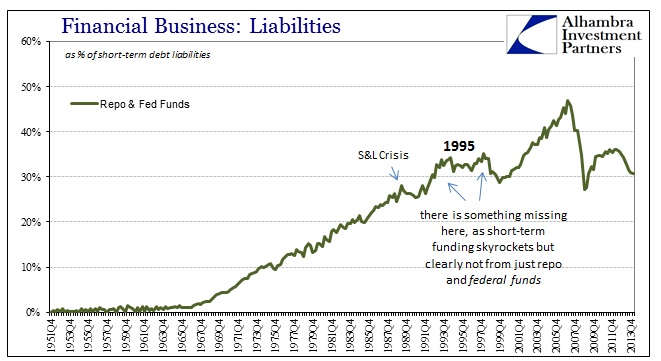
By 1995, federal funds and repos were already a third of total short-term liabilities, and they wouldn’t gain much more even to the highest debasement at the peak of the pre-crisis era. But that narrow classification offers just the necessary clue as to where to find the answer – the above chart only includes domestic repo and then federal funds as the unsecured funding alternative.
Anyone who has read even one article I have written should know the alternative funding source, the very means that escapes, to this day, the FOMC’s mathematically-driven gaze: eurodollars. Starting with the Amendment to Regulation D at the end of 1990, the proportion of wholesale finance dedicated to the “dollar” rather than just the dollar diverged tremendously. But even that was not enough of a boost to kickstart the “random” nature of the asset bubbles.
In 1995, for reasons that I myself have never come to terms with satisfactorily, the eurodollar market suddenly turned inward to speculative growth upon assets within the US. Prior to that point, and especially before 1985, eurodollars were dedicated almost exclusively to financing global trade as the replacement system for the Bretton Woods gold exchange standard. Whatever conditions altered at 1995 (and it was undoubtedly a combination of converging trends, including technology, communication and exhausted opportunity in trade exclusiveness) the inflection is obvious.
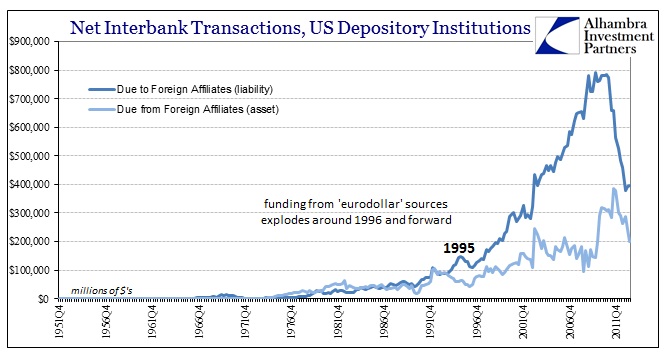
The chart above shows the surge in interbank liabilities flowing to the US from foreign affiliates. What that means is that from the middle 1990’s forward US banks were sourcing “dollars” from eurodollars as a means to fund their portfolios domestically. But that is only part of the “eurodollar” debasement that took place, even though it was massive in and of itself.
The other side is where we have the most trouble with direct observation. However, there are ways to tease out and unpack eurodollar trends from primary sources. The companion part to the piece shown above is foreign banks operating US subsidiaries. Here, the change in 1995 is the opposite as shown of domestic banks, but still indicative (I’ll explain this) of the overall trend in eurodollars as the primary bubble suspect:
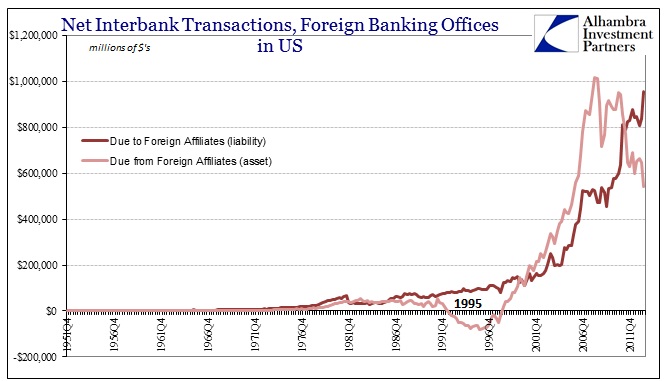
What this shows is that domestic banks were sourcing eurodollars to fund domestic balance sheet operations while foreign banks were sourcing (on net) federal funds to fund their offshore “dollar” portfolios. From the second we can infer the first, meaning that the “dollar” was apparent and excessive during this entire period in ways we cannot observe directly. There was enough of this offshore “dollar” market to both fund growth in domestic operations and to source expansion elsewhere. In other words, despite these trends being in opposition they both, together, indicate robust and sustained expansion of the “dollar” in total.
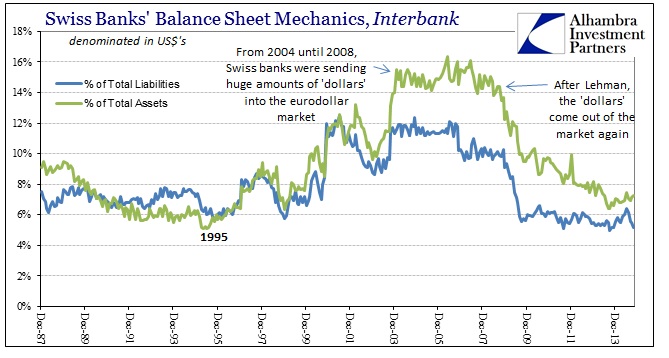
In some places this is actually directly observable, though that is the exception. As I have pointed time and again, the Swiss banking system offers just such evidence of eurodollar-based imbalance. Starting around 1995, there was a sharp and sustained surge in Swiss bank participation in “dollar” assets – to the point by the peak in mid-2007 more than a third of all Swiss bank assets were in “dollars.”
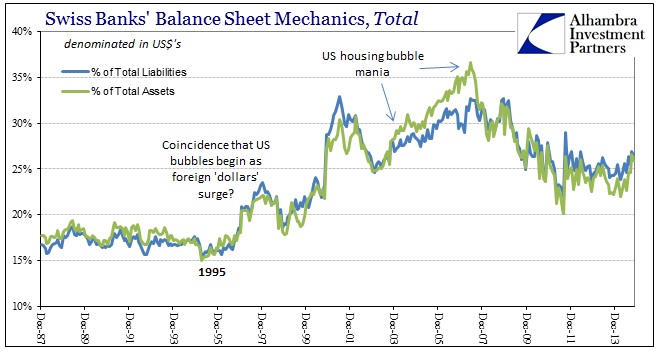
What that shows is that the liquidity measures of interbank markets were feeding robust bank balance sheet expansion in “dollars” outside the regulatory and convention of the FOMC, its models and even its basic theories about “rational expectations” and perfect market efficiency. There was nothing random about the growth of eurodollars, but because the FOMC apparatus refused(es) to acknowledge it, instead prioritizing only consistency with mathematical variables developed in 1970, the serial asset bubbles were promoted in what orthodox economics still posits as “random” errors.
And the Swiss participation not only shows the growth of bank balance sheet debasement (“dollar” supply) but also a huge source of “dollar” liquidity of and for eurodollars themselves.
In other words, this framework was a complete system that developed in “dollars” right under the noses of monetary policymakers – to the point that even observable, domestic banking was highly altered. And the best “explanation” they could come up with was “global savings glut?” The reason for that ridiculous theory is that they have to preserve “rational expectations” math or the whole dominant monetary system is falsified from the ground up. It also shows, yet again, why the FOMC got 2008 all wrong from the very start.
As Bill Dudley said at the September 2007 FOMC meeting (where the federal funds target was reduced, for the first crisis move, by an “emergency” 50 bps), “I think we have all been a bit surprised by the size of some of the conduits that some European banks were sponsoring relative to their capital.”
The last remaining question, the one that vexes me the most, is why in 1995 did the “dollar” start to intrude so much in domestic imbalances. There are no direct answers that I can find, and may be unanswerable and lost to history, though I have several theories that point in the direction of Alan Greenspan and the dominant financial trends of that era. In some respects, it doesn’t much matter as bubbles have rendered so much of monetary theory obsolete. The real question may be when authorities start to admit as much and recognize reality apart from general equilibriums – stop fitting the real world to their models and start coming up with models that actually describe something useful and meaningful.
Stay In Touch