
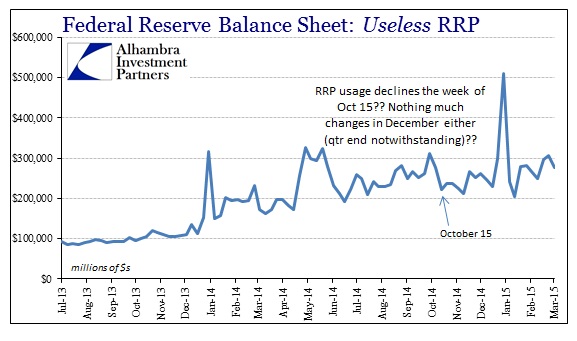
The FOMC continues to test out its exit strategies in a determined effort to try to gain a somewhat hard and durable floor under interbank rates. To this point, there hasn’t been any sign of any effect whatsoever. That would include the apparently semi-permanent state in which US$ repo persists under heavy fails. This negative condition is supposed to be addressed by the Fed’s exit strategy, especially the reverse repo program, but there is no correlation at all between repo (dys)function and RRP usage.
No matter how far in and out of collateral shortage the repo market gets, usage in RRP remains untapped in a conspicuously stable condition. That isn’t how this is supposed to go, as instability in general repo collateral should at the very least correspond to an increase, likely large, in milking otherwise idle collateral out of SOMA.
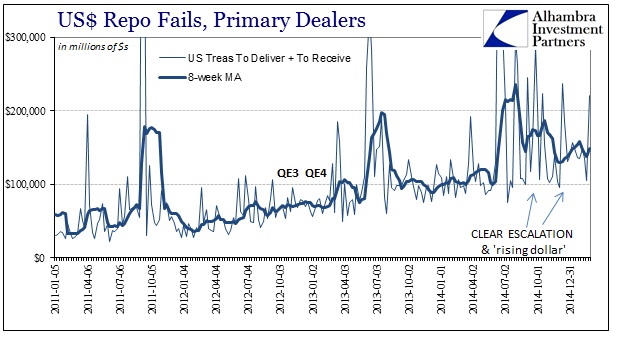
As you can see above, there is no relation whatsoever between reverse repo and repo fails, and thus repo rates which negates the idea of this as an “exit” or hard interbank floor. The latest weekly fails data sees yet another surge in fails, equaling the highest point (most illiquid) since mid-December – to which the current increase in specials should not be surprising.
Repo rates are again negative in many UST maturities, especially the 10-year benchmark. It should be far more alarming that the repo special for the 10s is an almost -2% rate regardless of this week’s auction calendar, but complacency has set about setting aside all serious views on this. That level of illiquidity indicates a deep state of attrition, which is told very well by this persistence of large fails. It’s as if systemic liquidity has been turned upside down ever since the middle of June.
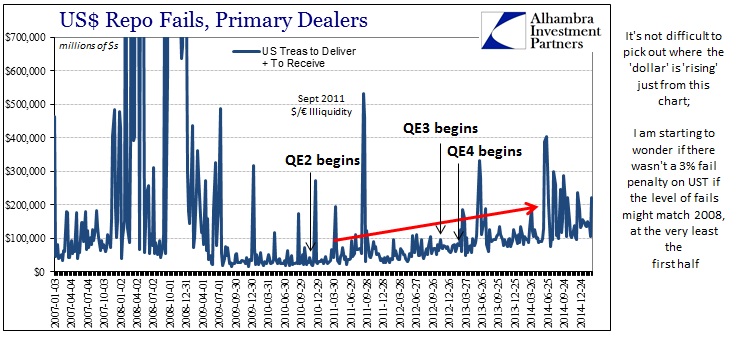
That is the important point about repo and repo mechanics despite the blatant attempt to ignore it by economists and those pushing the “booming” economy narrative. This de facto sustained illiquidity doesn’t necessarily preclude economic revival, but more often than not, especially at this level, it is a symptom of its opposite condition. As noted above, it’s quite easy to detect just from repo fails which time periods feature a “rising dollar.”
Is it then repo problems that give rise to the “dollar’s” rise, or is it the other way around for causation? I don’t think it much matters which is a symptom of the other, as they both amount to the same problem and signal. Liquidity in the modern system is as much about willingness as anything else, which removes the emphasis almost totally on “money supply.” Liquid “dollar” flow is a function of risk perceptions of the banking system, especially dealers, which amounts to the availability to exchange risk parameters.
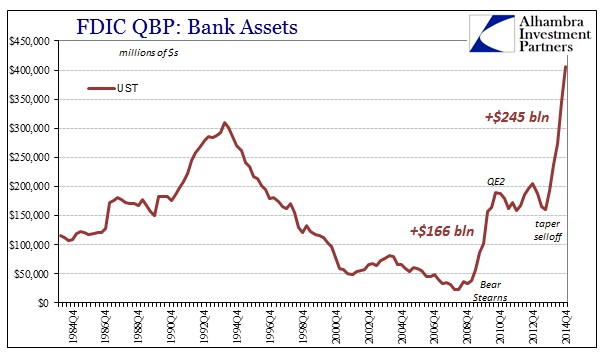
Illiquidity, then, is the condition where bank activities are being restricted by views on “risk”, especially expected volatility. The persistence of dysfunction is therefore transformational, which amounts to a serious inflection in “dollar” flow – which we already know from the FDIC’s Quarterly Banking Profile. That view extends to the “flow” of collateral as much as currency, as more often in this system currency is second to collateral in acting “money-like.” That would seem to place an emphasis on a healthy repo market as confirmation of a healthy financial system globally.
Banks have been “hoarding” UST collateral going back to Q4 2013, which more than suggests an intentional and sustained buildup of liquidity cushion in individual circumstances. That sustained illiquidity would breakout at some point should have been expected (and was by some), as the collective build of individual liquidity margins is axiomatically at the expense of systemic availability.
All that means is that systemic function is degraded and that the continued repo problems show that the risks of a serious “event” are dramatically heightened. Monetary policy posits, actually demands, that asset bubbles and crashes are “random” acts of unknowable confluences. Yet, here we have good evidence of if not illiquidity in the worst sense then at least its precursor condition. After all, this same type of behavior was practiced in the buildup to the failure of Bear Stearns in 2008 – it was evident that there was “something” drastically wrong with systemic illiquidity that wasn’t so easily fixed by interest rate cuts and half-hearted “swaps” colored and covered by nothing more than soothing FOMC reassurances. No one needed to be told that a crash was coming, only that they should not ignore all the relevant warnings because orthodox economists believe in noting more than rational expectations theory.
If crashes are actually confluences, and it is likely that they are, that doesn’t necessarily mean they are random or unknowable in advance. In fact, the history of major “events” of the past decade, and even going back to LTCM in 1998, shows a distinct and regular pattern.
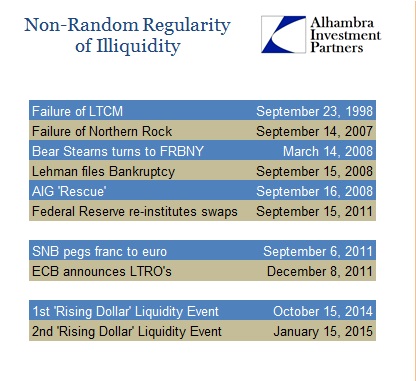
In the first block of “events” shown above, it is almost perfectly symmetrical that major illiquidity shows up in the middle of the month just before quarter end. This is something I have covered before, in that the “system” exhibits “hidden” recklessness only to shade and disguise such activity under window dressing. But it isn’t just moving numbers around on presented call reports and balance sheets, as there is a clear correlation between that attempt to look less risky and the regularity by which such efforts produce the worst results. It obviously creates a strain that when combined with other negative factors leaves “markets” susceptible to terrible and dangerous “breaks” and disorder.
Just in the past five months we have witnessed and experienced two additional liquidity events; though orders of magnitude less than certainly 2007 and 2008 still serious in their own right. However, instead of taking place in the middle of the month before quarter end, they both occurred (or at least punctuated an endpoint) in the middle of the month just after quarter end. That is not random chance.
We know that there were serious declines in reported “dollar” liabilities by banking entities in both September and December 2014 – the months just prior to those two outbreaks (though only reported months afterward, thus offering only confirmation what reasonable supposition about liquidity suggested beforehand).
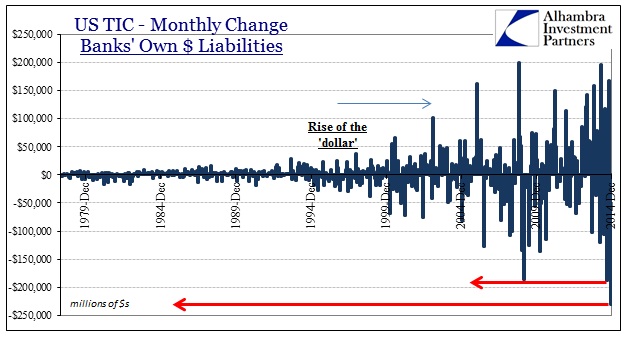
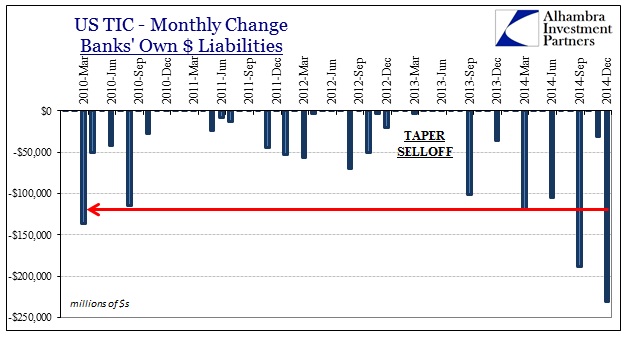
But if you examine the data more closely, you see that there is an obvious regularity in this behavior that started after the massive taper selloff in 2013. Every quarter, in the last month of the quarter, banks have reported a decline in “dollar” liabilities. The change in October and December was the degree of that retrenchment, which reinforces the idea that the system is overly susceptible to “shocks” around quarter end (it should also be noted that November 2014 was unusually negative as well, which might help explain why December was so drastically bearish in any number of indications, leading right into the January 15 event.)
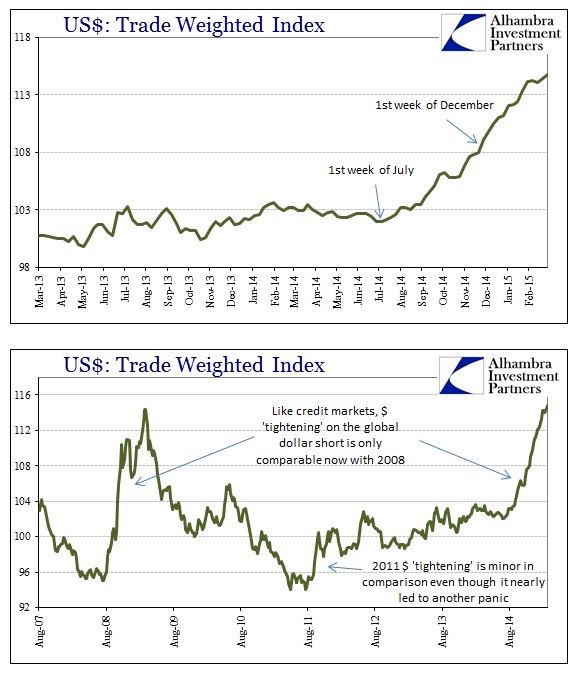
None of this is to suggest that there will be a huge market crash already set for April 15, only that the probability of seeing such an event is much greater than anyone seems to appreciate. The continued problem in repo markets is a precursor, as is the related “tightening” in global “dollar” flow (that mimics a supply issue). Those strains have proven in the past to be augmented enough by quarter-end activities in order to produce some of the worst market results. Crashes are not random events, nor are they even “tail risks” and wouldn’t be counted as such if conventional statistical thinking actually incorporated or at least tried to understand these factors.
Strain is evident throughout here, and that is an indictment that ensnares a lot more than just repo markets or how banks publicly account for themselves. It is a signal that the global economic world is deeply sick, and thus dangerously low on margins of safety should something ignite even a minor “run.” The longer it goes on without alleviation, the probability (from a systems perspective) only increases. The notion of “tail risk” couldn’t be further from actual function, as regularity obliterates the idea of rare.
Stay In Touch