
Taking a look back at economic projections from orthodox models (and the theories they incorporate and encompass) is more than just a review of past econometric failures. That is the most obvious component as the ability of mainstream models to forecast actual economic conditions is inarguably flawed beyond repair. That calls into question, certainly, current outlooks based upon the same premises that have been so unreliable throughout this “cycle.”
However, there is more to it than just bad predictive capacity. Looking past the specific year-to-year failures there is a larger sense of economic function that can no longer be ignored even by orthodox disciplines. This divergence between expectations and reality is leading to a significant, wholesale downgrade in the US economy.
This is a huge development over the past few years as the actual economy has forced a major reassessment; something that seems to have escaped mainstream attention and certainly some investors in certain asset classes. To be blunt, orthodox economists have been the biggest cheerleaders for stocks above all and have provided the greatest source of proclaimed fundamental basis for the huge multiple expansion taking hold there. Their view on the longer run economic trajectory, especially as distinct from the short run, is supposed to be the rationale for record after record in stock prices and a new secular bull market.
For such an occurrence you would expect, then, that the lack of economic growth to this point is an aberration. In other words, the persistent failure of the economy to fully recover in the short-term is typically blamed on a nondescript “debt overhang”, a personal sector deleveraging that will clear itself up at some point and the overall “boom” will itself resume. The only problem thus far, in this line of thinking, is that economists have been unable to determine the time component.
That has led, time and again, to overly optimistic expectations to be undercut by current estimates. This is not new, of course, as it was a persistent feature even in the Great Recession itself – which suggests more than a temporal blindspot about just the personal sector’s balance sheet.
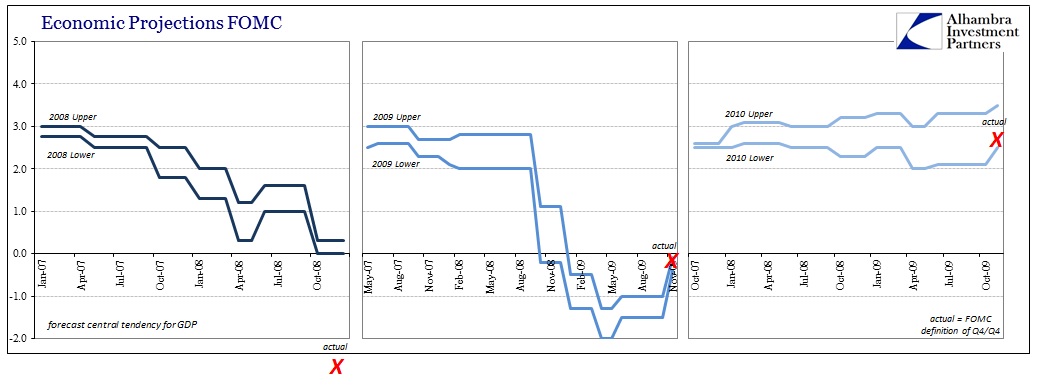
What I have reproduced here is the FOMC’s estimates for “central tendency” of real GDP in time. In January 2007, while the housing bubble had already started collapsing, the FOMC was expecting 2008 GDP to fall somewhere between 2.8% and 3.0% (NOTE: the FOMC defines yearly GDP as the Q4/Q4 change). Of course, they were wholly unprepared for what was coming, as actual GDP is currently observed to have been -2.8% for 2008. What was really amazing, and ultimately destructive to anyone following this view, was that after April 2008 the economic assessments were upgraded so that by the time Lehman failed the FOMC was still projecting low but stable growth: 1.0% to 1.6% as the world fell off a cliff.
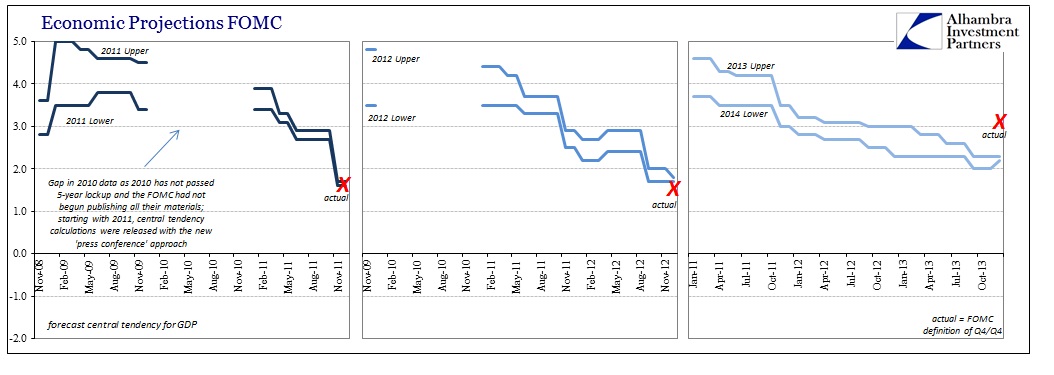
In fact, over the history of the “cycle” to come, this was a persistent element of each yearly projection, as this feature was partly based upon unrealistic views of what monetary policy could do and where it could actually reach. The only year in which they “got right” was 2010, which actually makes sense in the context of the larger dynamics here.
In other words, it isn’t just that the FOMC starts consistently over-optimistic and the economy persistently undershoots time and again, but rather there is a more basic evolution that is much more relevant to today and tomorrow. If you look at only the starting estimates (for the upper bound) and where GDP actually finished, the pattern is glaringly contradictory to the bull case.
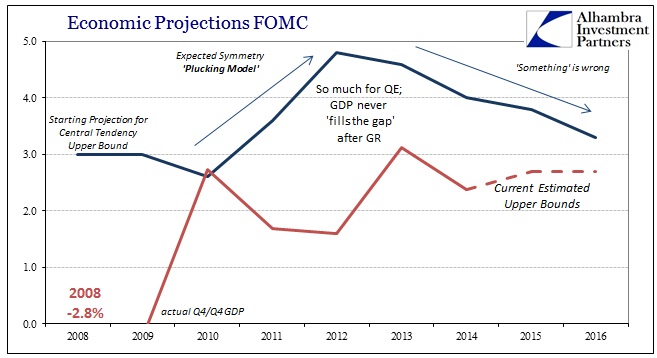
The blue line above denotes the initial upper bound estimate for the FOMC’s central tendency of real GDP; the red line is the actual computed value from the BEA, again Q4/Q4 (which leads to a discrepancy in some years, notably 2013, using the average quarterly method). What this tells us is the purest form of theory under the orthodox conventions as these initial forecasts are made more than a year in advance of their target calendar space, meaning they are not as “sullied” by actual outcomes.
The pattern or trajectory makes perfect sense inside the orthodox understanding of how an economic cycle functions. Though they missed the Great Recession entirely, once it became apparent that it was deep and broad, economists and their models adjusted their recovery expectations by that observation. In other words, Milton Friedman’s “plucking model” was every bit expected as it has been in the past. The deeper the Great Recession went to its trough, the more upside was believed “available” in the recovery.
That is why, for instance, the first estimate for 2012 GDP was pegged, at the upper bound, at 4.8% in November 2009. By then, the Great Recession had been shown to be a serious setback and so it was assumed that the recovery would be its opposite in both direction and intensity – preserved symmetry. The task for the FOMC, as they saw it, was to remove any financial impediments in order for the economy to follow its own trends back to “potential.” That is why, time and again, initial estimates have started out as high as they have, as this idea of symmetry between recession and recovery forms the basis of all economic cycle predictions.
So the fact that the FOMC’s central tendency forecast for 2010 ended up being correct again makes sense, as that year was the first calendar year without any recessionary pressures. And the economy did respond, at least at first, as it actually looked for some time as if the V-shaped recovery might have been a possibility. It is what happened thereafter that is most important.
By the time of the initial forecast for 2014, rendered in January 2012, “something” had changed. By then, symmetry was being obviously violated as GDP continually underperformed, which is actually an overstated economic case since GDP is designed to be the most charitable toward economic measurements. Labor markets, by contrast, have not been on so much of a rebound as GDP. For QE2 and beyond, the theory was simply that there remained financial impediments in the economy that were preventing full recovery, but that each successive monetary program would eventually clear those up and the recovery would proceed as intended.
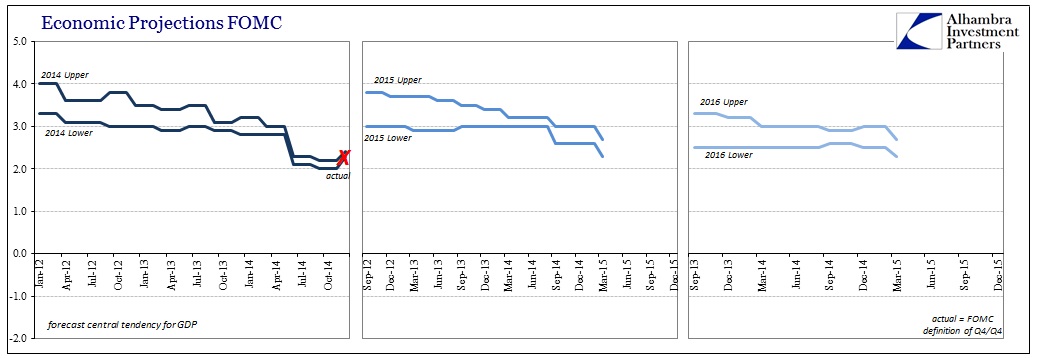
While this has not been recognized, the FOMC has been steadily marking down GDP projections finally admitting there will be no symmetry in this “cycle” at all – which calls into question whether or not this is even a cycle. And that is the major point here, in that even economists, those most bountiful in their outlooks for the US economy, are admitting to structural damage or displacement that is far, far greater than anything anticipated. In other words, the greatest stock market cheerleaders are now calculating long run damage to the US economy, opened up at the Great Recession, that cannot properly be scaled.
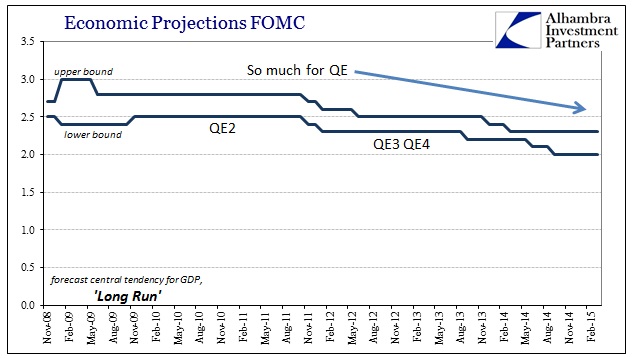
In late 2008, the FOMC began producing its “long run” view of the economy’s central tendency, which amounts to essentially an estimate of economic “potential” (if that concept makes any sense even in rough contours). This reflective violation of symmetry has led to projections of potential being cut by ½ % per year – that may not sound like much but it is an immense downgrade on future consideration with very serious economic and ultimately social implications.
This is widespread throughout the professional economic class, not limited to just the Fed’s views, as it is universal across models and systematic calculations. The CBO, for example, produces its own version of “potential” based in large part on the same assumptions as those that drive the FOMC’s ferbus et al.
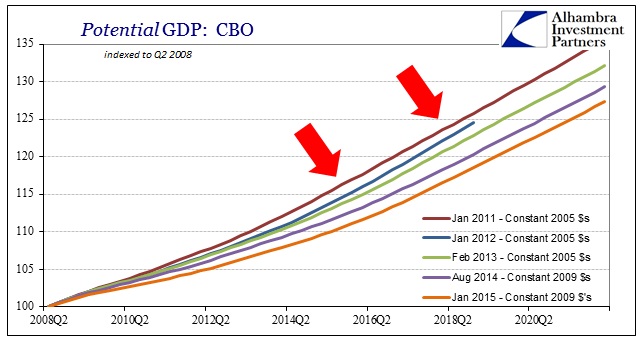
In January 2011, the CBO, like the Fed, predicted no long-term damage or disruption due or related to the Great Recession; symmetry was thought preserved and any disruption from trend was believed “transitory” or an aberration. In the years since, that view has been forced to evolve by this persistent and actual malaise, such that the current view on potential is immensely unproductive compared to the symmetric counterpart – despite Yellen’s claims of recovery and upswing, notice how far the January 2015 estimate has fallen from just last August! If these numbers come anywhere close to being accurate (a big if, I know), the difference between symmetry and the current view is almost $1.2 trillion by 2020 – by rough comparison, extrapolating a rerun of 2008 onto that 2020 GDP would only have seen a $561 billion decline.
In other words, using these very speculative figures, the damage to potential is thought to be on a scale roughly twice that as the Great Recession – except repeated year after year.
None of this enters the mainstream because the policy class is beyond coquettish about it. You hear Janet Yellen and economists talk about the output gap in terms of the supposed upswing currently, as she performs an intentional bit of misdirection. She talks about the closing of the output gap and then allows most people to infer it has taken place exactly like it has in the past, via full recovery of growth. In other words, she says that output gap has closed in the context of her perceptions of the current upswing without ever making clear that the output gap has been wiped out solely by the long run downgrades in assessments of potential.
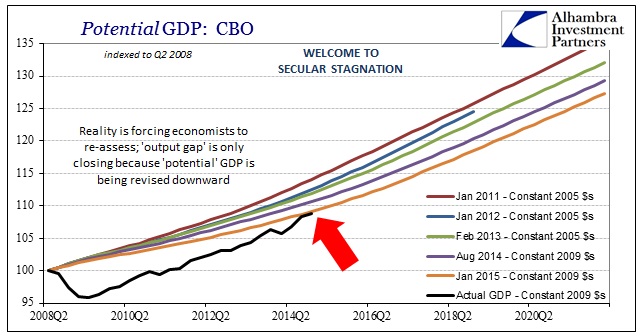
The impression left by this is one in which the economy has recovered when in fact that could not be further from the truth (at least until we see how 2015 develops, and whether cycles within deficient cycles make for even more downgrades). Every other cycle has seen the closing of the output gap via growth alone with “potential” undisturbed, a fact that she is counting on to be mixed into the current view. It is almost dastardly in how this technicality is deliberately used to foster the recovery narrative as she wants you to see it when in fact it actually proves (to the math involved) the exact opposite!
Those that make the case for a new secular bull market do so on the view that the current rut of weakness is but a temporary obstacle that will eventually be overcome by prudent policy and time. That was the view held by policymakers, but it is not anymore – though they have been careful not to disseminate that too widely lest it upend any emotions about asset bubbles and economic function (rational expectations). This does not disprove the secular bull case, but it does substantially weaken it, not the least of which is that those that have been most enthusiastic about it are the very people no longer accepting it. Of course, these numbers could all be just as wrong as the FOMC was heading into the Great Recession, but intuitive sense is on the side of these revisions and most decidedly not on the symmetry case.
Now that this has been admitted, a complete break with past doctrine, we can only hope the next step is identifying (properly) the cause. “Secular stagnation” as a new creed is not a good sign. “Something” broke the US economy, and the world is paying for it even if only certain financial markets (“dollars”) are just now starting to appreciate its effects.
Stay In Touch