
Usually references to April 15 are reserved for income taxes, but in this case that preference may be superseded. Recognizing the illiquidity pattern of the “rising dollar” means being vigilant toward the next expected instance. If October 15 was an “event” followed by January 15 in succession, then it is reasonable to at least anticipate conditions for April 15. To that end, “dollar” liquidity had been moving far, far tighter beginning earlier in March. The FOMC meeting and its “unexpected” dovishness seems to have abated that trend, though perhaps only temporarily.
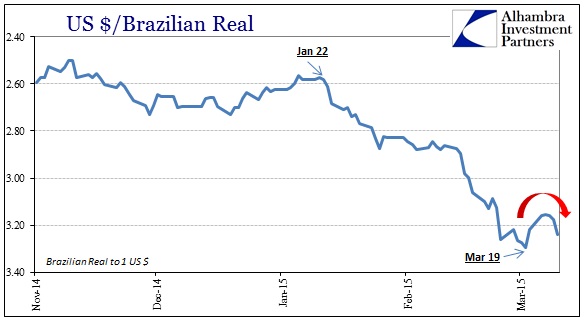
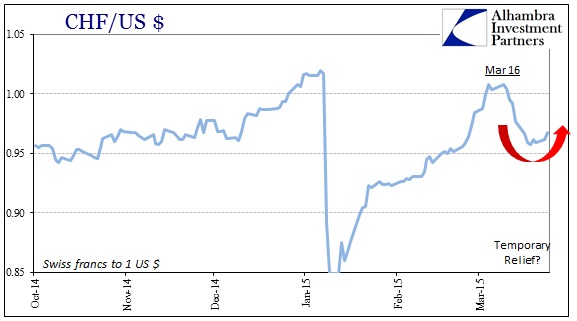
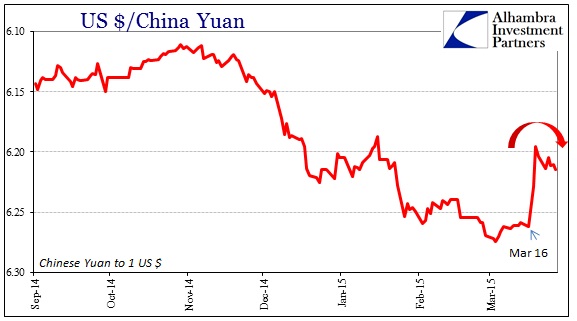
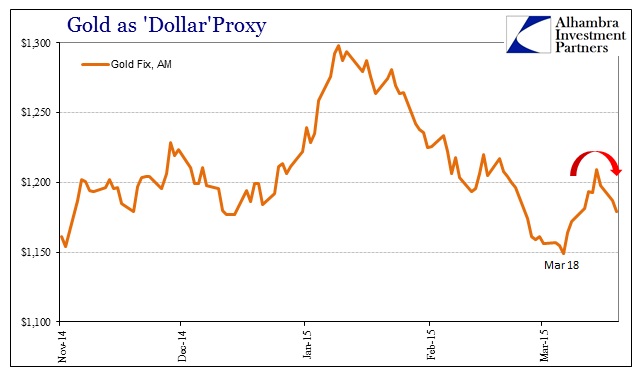
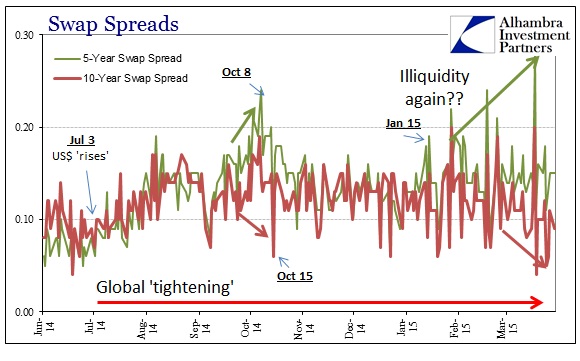
If there has been a liquidity reprieve, we certainly know it in the “dollar’s” behavior in the days leading up to and following the March 18 FOMC statement. Regardless of how it was interpreted, the major functioning funding currencies, mostly the BRICs with Switzerland tossed in, clearly were sailing toward a heightened problem until around March 18. Backing off some seriously stressed levels, there are again indications that whatever reprieve was to be may have already been exhausted. The fact that this inflection possibility shows up almost everywhere in liquidity/currency crosses seems to suggest that the FOMC disruption wasn’t a permanent alteration.
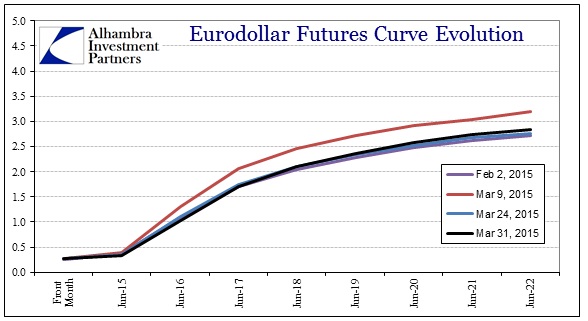
By broader credit market accounts, this is not unexpected. Despite the close-in change around the FOMC, other more broad credit indications have persisted at least around where they were on March 18. The eurodollar curve and even nominal treasury rates have not budged all that much in last two weeks of the month. That can be interpreted in various ways, but to the point about liquidity concerns it would tend to propose continued pessimism if not rapidly moving in that direction.
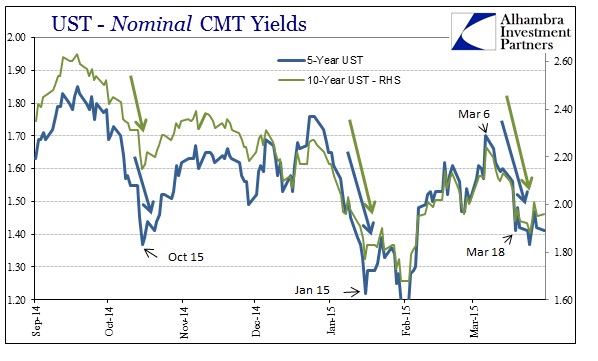
I think that interpretation is augmented by the shape of the UST curve which has somehow attained an eerie and maybe unnatural stasis that is curiously out of alignment with anything seen in this “cycle” (and doesn’t much occur in any past “cycles” either).
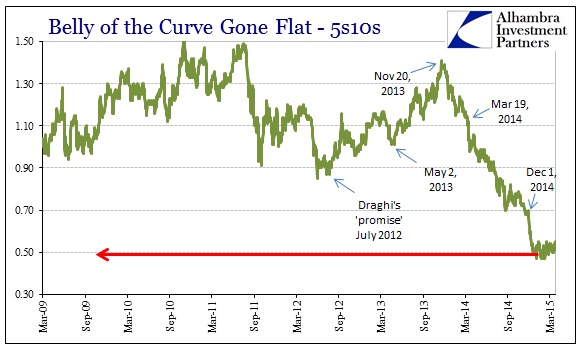
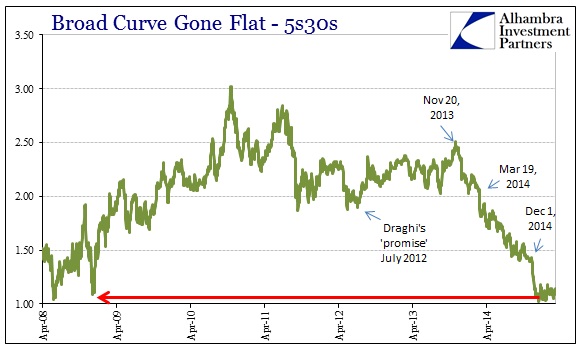
It has been almost three full months since the curve stopped changing shape, a unique circumstance very reminiscent of how inflation breakevens did the same from the mid-2013 selloff until June 2014 when the “dollar” started all this mess. In the context of breakevens, interpretations were close to straightforward as it amounted to markets not quite ready to follow the mainstream economic narrative upward (as a full recovery “should” have led to vastly expanding breakevens, meaning higher “inflation” projections), but also not quite ready to throw in the towel on the recovery either. In the end, they did so but only after serious confirmation across liquidity as the “dollar.”
We might be witnessing something similar here, though the UST curve is supposed to be far more complex and liquid (read: fluid not static; who would have thought the UST curve could drain of so much market-like behavior?) than breakevens. That renders any analysis much less determined, though we can reasonably assume it relates, as breakevens, to any uncertainty about what the FOMC might do next. After having demonstrated an almost unmistakable rejection of the recovery-leading-to-tightening idea from the Fed, it may be that the credit markets are waiting for the next definitive signal that the FOMC is either dedicated or softened to the suicidal course.
Without budging for March 18 and the latest “dovishness”, however, would tend to suggest, if this is correct overall, that credit markets are not yet convinced of any policy shift and/or whether or not that will matter to economic conditions (it may already be too late).
So the unflappable pessimism in credit these past few months would seem to confirm that at least perceptions are still conducive to an April 15 update to October 15 and January 15. It is further interesting that in terms of repo conduits for liquidity that MBS repo has clearly added capacity and thus taken up some of the liquidity slack since the depths (domestically) of the October 15 version (how much of that relates to the end of QE3 and the fact that it is now no longer locking up otherwise usable MBS collateral?).
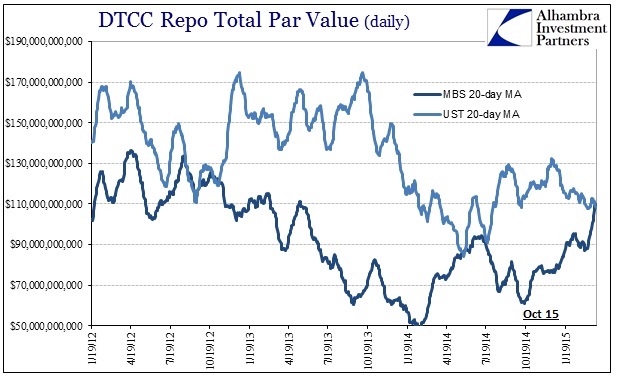
While that sounds like a softening in the illiquid tendency, it actually may indicate the opposite as overdependence, marginally, on one source can lead to bottlenecks and thus actually contribute to the next problem. In short, we can’t tell if the take-up in MBS repo was organic or forced, but there have been recent clues more toward the latter. To wit:
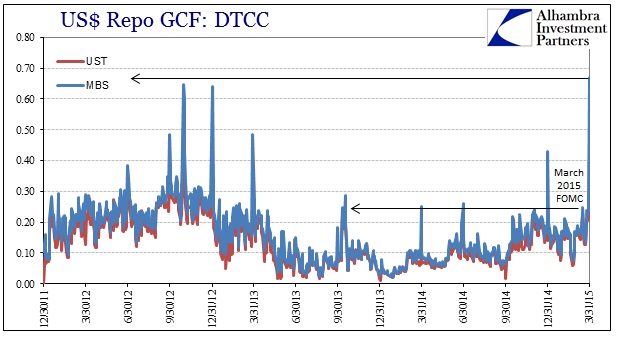
Today’s quarter-end repo rates (GC) were the highest they have been in years, coming shortly after March 18’s surge in repo rates. In other words, a little too much drama has occurred where it likely should not have had MBS repo been building as a dependable alternative to everything else. My own interpretation is that MBS repo here has been a last ditch in March (notice how repo rates have, overall, risen since October just as repo volumes have increased).
In summation, as you might expect, there is nothing definitive about what we might see heading now toward April 15. There are some indications that liquidity has tightened once more and that overall credit is not yet letting go of the disabling view, but the “dollar’s” reversal around mid-March muddies any expectations. The conditions are present for a liquidity problem, especially what has been shown of MBS repo, but we have no way of gauging how much perceptions shifting on the FOMC may have altered bank balance sheet constraints. It should at least make for an interesting two weeks.
Stay In Touch