
This post is actually a companion to the last, looking into the discrepancy of breakevens with the broader credit market, but I felt it deserved attention all its own. As noted in that prior discussion, there is little indication that credit markets are at all re-evaluating prospects for “inflation” and recovery. If anything, they remain curiously stubborn against it even if they are not again, at this moment, moving rapidly in that pessimistic direction. In this case, absence of activity has to be taken as further suspicion because everything remains not brightly positioned steeper and higher but rather stuck at down and flat (indeed, this curious stability itself argues for a negative interpretation on credit interpretations).
That includes especially funding markets, which remain in some places likewise to the treasury curve. The eurodollar curve, for example, remains conspicuously lingering around the “worst” or most pessimistic views from early February.
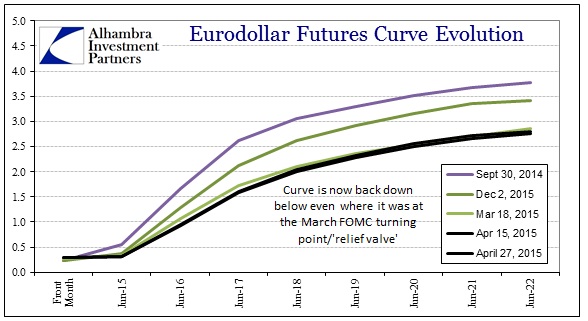
The fact that the curve has failed to budge, at all, in the past few weeks despite the “dollar’ and crude swinging quickly in the other direction more than suggests that deep uncertainty and concern remain. To some extent, the swaps market seems to at least agree, but swaps may also be moving in a direction that is actually cause for greater concern – which is why I wanted to separate the analysis.
I noted last week that there is not just time value in bonds and credit, but also the same hierarchical structure for interbank existence. The reason for that is simple, as order in function produces order in results – the inverse case being equally valid. We can infer a breakdown in basic hierarchy as being suggestive of disorder in function.
In the past few months, just as breakevens have begun to warm the hearts of economists again, swap spreads have been decomposing out of their “expected” orderly arrangements. I have observed and highlighted this from time to time, but it has grown steadily divergent going back to around early January.
In this case, there is a maturity inversion between swap spreads (a negative spread of spreads). Again, hierarchy should apply here, and the spread of the 10-year spread (all else equal) should be positive to the 5-year spread. Swap spreads themselves give us some limited insight into both credit risks (as the swap rate is compared to the applicable UST yield) but also liquidity risk more broadly.
Examining the history here of the swap markets reveals just that.
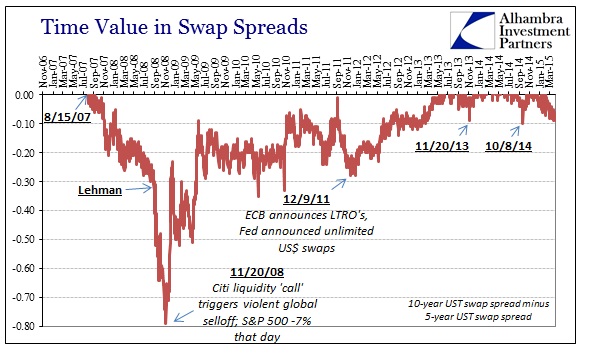
The major swap rates propose a lot about hedging activity, both demand and supply (inferred from corroborations elsewhere), especially the 10-year which is pegged as an enormously important benchmark. Thus, the upset of time value in swap spreads coincides with periods of great liquidity disruptions as an expression of whatever balance sheet constraints are most dominant. After Lehman, for instance, the 10-year swap spread dropped while the 5-year rose, echoing the same difficulties in termed funding in other places (such as 3-month LIBOR rising far faster and higher than 12-month LIBOR). In other words, these upsets in the term structure of interbank rates related to drastic liquidity concerns being carried out into the market place via hedging demand and supply, revealed by abnormal relations among what should be very ordered swap rates and spreads.
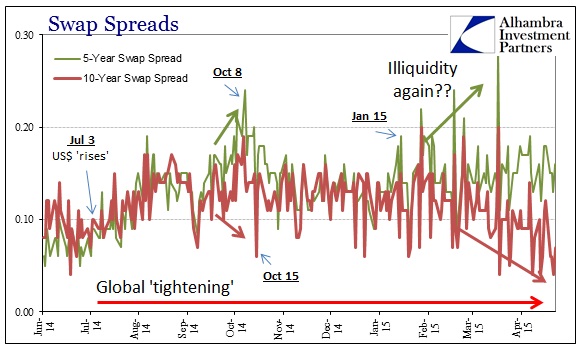
More recently, illiquidity has been suggested by the negative spread of spreads around taper in 2013, culminating with a major move on November 20, 2013 (hinting at great difficulty somewhere, likely in the MBS market, that has yet been explained or revealed; but the fact that the entire credit market pivoted at that exact date is pretty close to conclusive proof that something major occurred). We saw that again in the weeks leading up to October 15, 2014, which means that instead of HFT or computer trading causing UST havoc that day it was just the final blowoff in a liquidity event that stretched back some ways in time and in funding market depth (which would be much more concerning, and thus hints at why there is such emphasis only on the computer trading aspect).
Going back to early January, however, as you can see plainly above, disorder has crept back in more durably; the 10-year swap spread has dropped somewhat while the 5-year spread has increased somewhat. That they have remained in this disorderly shape is what is concerning far more than the actual degree to it. Indeed, the “dollar” behavior in 2014-15 is far more asymmetric than during 2007-08, which means that more minor disturbances are producing much fuller and disruptive tendencies across the board.
The direction of the spread collapse is obvious, and thus suggests (in concert with other interbank indications I looked at last week) that very much contrary to “inflation” breakevens there is and remains dysfunction and illiquidity – there is imbalance somewhere and it is not relenting, a fact that is replicated across credit and funding markets. More troubling, however, is that the shift on March 18 in accepted policy expectations has absolutely no imprint here, which means that this decay is not strictly a matter of what the FOMC might or might not do. That would seem to suggest that funding markets are thus pessimistic about more much than just monetary policy, and in a durably uncertain fashion.
Stay In Touch