
Along with this morning’s atrocious retail sales report comes more bad news for economic statistics that have been at least clinging to the recovery narrative. My biggest complaint with the Establishment Survey is that I believe the BLS in constructing their measure of variability has been overly optimistic in its trend-cycle component. In the 1960’s and especially the 1970’s, economic accounts such as retail sales and the main employment figures transitioned to stochastic processes which introduced several concepts, among them trend-cycle. In other words, the BLS does not actually count the number of jobs (nor does the Census Bureau total up the receipts of retail establishments) but rather estimates the monthly variability around an assumed benchmark using statistical survey processes and population assumptions.
The benchmark, then, plays a huge role in setting the overall course of whatever economic account is being “surveyed.” In the 1970’s, it was found that trend and cycle were, by far, the largest sources of variation which meant that each account reference was better served by adding a supposition about these general economic factors. This is why revisions are so drastic after a recession is declared, as the benchmarks have to be reworked with a greatly different trend-cycle variability component (more emphasis on cycle).
For the most part, this functioned well as cycles were pretty well-defined into the 1980’s. Even in the 1990-91 recession and at least the downshift into the dot-com recession there was a more well-defined cycle to them. If was after that 2001 recession, into the first universally decried “jobless recovery” that all this has become much less precise or distinct. I think that has been the biggest problem especially with the payroll report as the number of jobs just doesn’t match anything else in this part of the cycle, especially spending figures and especially in the last year or so. The most prominent explanation has been that whatever jobs are being created, robustly according to the Establishment Survey, just don’t pay all that well, or that in combination low-paying jobs and further assumed deleveraging are keeping robust payroll expansion from transitioning as it had in all prior “cycles.”
There is already a glaring contradiction in even that explanation as I described with the productivity figures. That leaves us with a choice; either businesses are no longer interested, at all, in labor productivity and have taken to ignoring it fully, or the BLS is simply overstating the labor “surge” by no small amount.
What is very interesting about the retail sales figures this morning is that they include a large benchmark reassessment relating to the 2012 Census updates.
As described in more detail in the Technical Documentation, the estimates derived from the annual survey are based on a sample that is much larger than the samples used to produce the monthly sales and inventory estimates. MRTS estimates are benchmarked to the results from the 2013 ARTS, which have been indirectly benchmarked using the preliminary results of the 2012 Economic Census and reflect a revision to the 2007 Economic Census affecting NAICS 443112.
With that new benchmark reference in hand, the updated monthly chained variations produced a significant downward shift in estimated retail sales – particularly after 2011.
A mathematical result of the benchmarking methodology is that, for a given NAICS code, all published monthly sales estimates after December 2013 are derived by multiplying the Horvitz-Thompson estimates by the ratio of the benchmarked-to-input estimate for December 2013. This ratio, which is called a carry-forward factor, remains the same and is used to derive published monthly sales estimates until the next benchmarking operation.
That suggests, despite the downward revisions in the past benchmark, that the Census Bureau is still likely overstating the trend-cycle component in their estimates. For the 2013 new benchmark, the difference in monthly retail sales figures is not enormous in isolation.
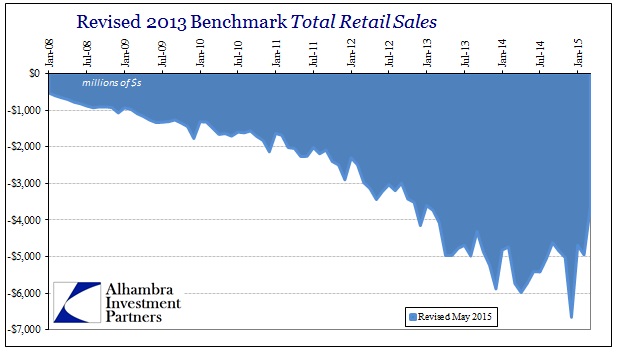
By December 2014, a paltry Christmas season as it was, total retail sales are now almost $7 billion less than first thought. The overall growth rates are largely undisturbed because of what I noted just above, but the overall retail “demand” component of the economy is more than a little smaller than everyone assumed (which wasn’t all that good to begin with).
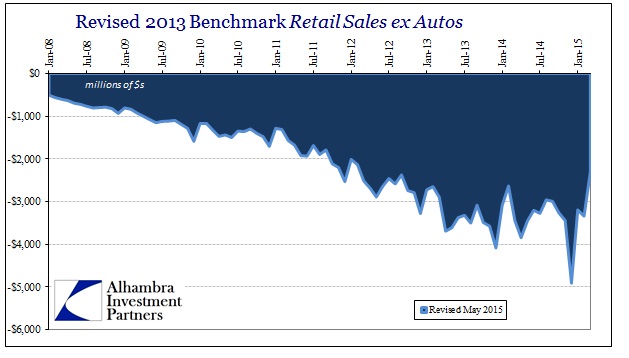
These revisions also applied to the other pieces of the retail sales figures, including auto sales which received an important downward revision.
Again, the benchmark changes are not enormous in the individual monthly figures, but $7 billion is also not trivial especially as that accumulates over the course of time. For all of 2014, there is now $64 billion less in cumulative retail sales due to this benchmark change. Going back to the start of 2012, the cumulative change is $171.3 billion, really placing some greater emphasis on the 2012 slowdown. It adds a great deal of weight to the idea that numerous economic accounts are overestimating positive variation due to nothing more than the assumed trend-cycle component. It is further significant that spending is being adjusted by benchmark revisions now since it is spending that contradicts the payroll numbers in the first place; now that inconsistency will be even more blatant.
The post-crisis era poses any number of challenges in the real world, but using correlations and assumptions from past cycles should at least receive a great deal of scrutiny before entering the network of stochastic linkages for the economic estimates everyone uses to judge all of this. It is not enough for the Census Bureau or BLS to simply assume a conforming recovery (or even a now-amplified one) when practically nothing has been to this point, including even payrolls if only glanced from the proper peak-to-peak perspective. I understand the basis for trend-cycle analysis, and it makes a good deal of sense for “normal” circumstances, but here in 2015 going back to even 2007 (and maybe even 2000) there is almost nothing “normal.”
Unfortunately, the net effect may be that it has provided optimism and hope where little “should” have existed; a basis for a recovery dream that is time and again proven exactly false. This is perhaps a start toward reconciliation of that fact. It will be interesting to see if the BLS’ next major benchmark follows suit.
Stay In Touch