
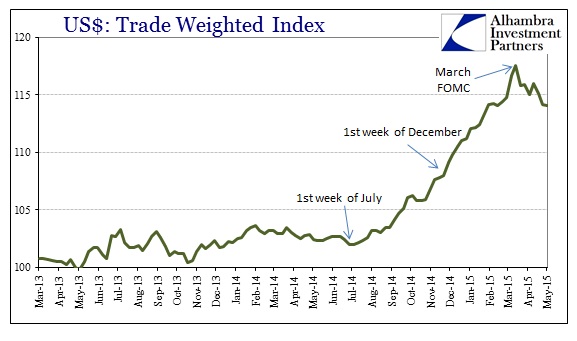
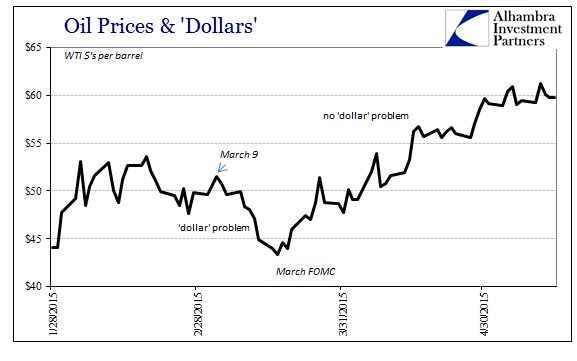
Since hitting it most recent low in mid-March, spot WTI has rebounded about 40% reaching above $61/barrel at one point. The ultimate low, which brought the physical price down under $43, was on the morning of March 18. The FOMC statement later that afternoon has been taken as a removal of any close threat to ZIRP, taking enormous pressure off the “dollar.” But the abatement of such compression is not necessarily the same as initiating its opposite condition; if tremendous “dollar” buying were to scale back it does not mean that everyone has now turned into a “dollar” seller.
There are numerous indications which suggest that funding is only taking a break (if even that) after March 18 and that in between has been more of a listless lack of conviction in any direction. That hasn’t stopped certain downstream markets from running away in the interim. Some of that, especially in credit, may be related to what I think are rising expectations for a renewal in QE (or perhaps some other more creative means for doing very little) but there is also just plain speculation and momentum.
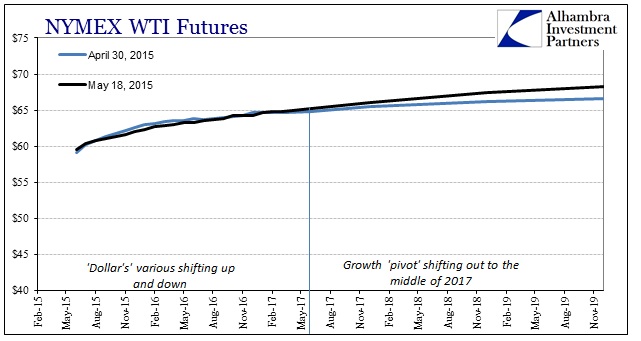
That seems to be where the oil market is, falling somewhere in between raw speculation and being attentive about the “dollar” pause. The front end is seemingly a high beta version of the “dollar” while the back end is stapled into the mid to high $60’s. Interestingly, in recent days the curve has moved away from backwardation as the outer maturities increased somewhat relative to late April. However, for the most part the WTI curve has become rather stale of late as it seems that open space in the “dollar” has been long enough for pure momentum to begin to fade.
That raises the question that if a 40% jump in prices is not enough to achieve the more “natural” backwardation, then maybe fundamental imbalances, of both finance and economics, aren’t yet ready to let go of price dynamics.
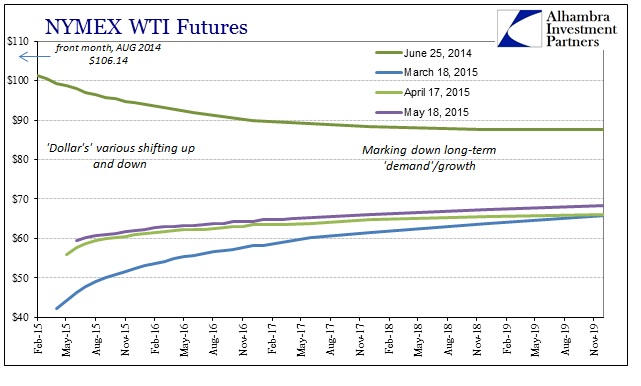
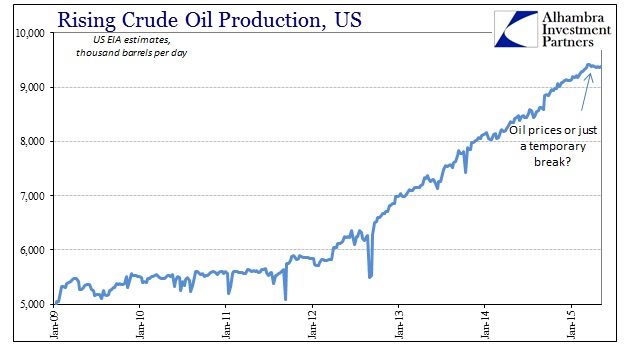
The curve has become much, much flatter in the past month and a half, but there are clues that this is more about supply than any change in demand. While supply factors were blamed, relentlessly, for the collapse in crude prices on the way down the actual trend in production was almost a straight line, making any extrapolations extremely easy to make. There were no surprises in production and supply, meaning that any shock that would drive a 60% crash in prices was on the demand side.
It was the combination, then, of the “dollar”, straight-line production, and the accumulation of so much physical crude through contango that brought oil prices to March 18. The flattening of the WTI curve might, in isolation, suggest that all those factors are now in reverse, but the primary physical change has been a noticeable inflection in production. In other words, the very basics of economics are evident here as when prices fall so does supply (eventually).
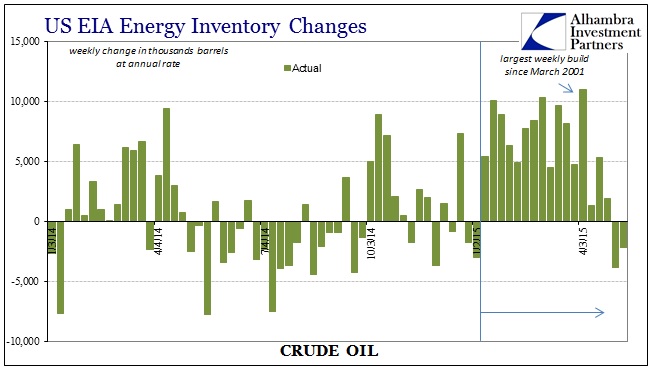
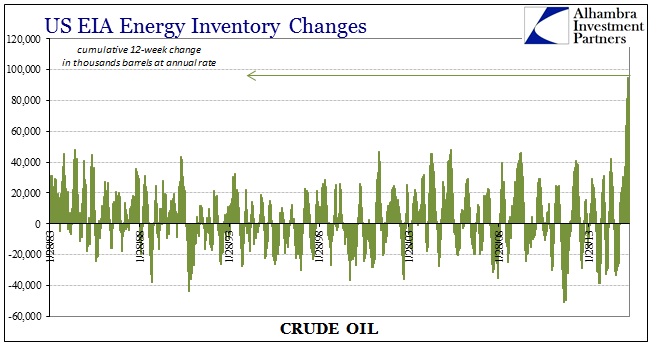
It isn’t a monumental shift, but oil production can’t simply be switched off on a moment’s notice which is why the price changes are so exaggerated. It isn’t clear whether this production change is the reason for the shift in inventory accumulation or whether that is due to the collapse in contango (likely some of both), but in any case the purely physical imbalance may have found a much less drastic footing. Inventories have declined for two consecutive weeks, though since they remain at historically high levels it isn’t clear if this is a definite shift in trend and trajectory or just one of hope and perception.
In short, there isn’t any actual indication that crude prices even lately are telling us much about demand – and that is what, again, basic economics preaches. At some point, given a price shock of this magnitude and what was clearly a drop-off in demand, supply would eventually start to equalize. That, I think, is what the futures curve is more than suggesting, that the supply side has been struggling for months to come up with solutions within this new lower-demand paradigm and that, combined with the “dollar’s” pause, has produced a more stable market relation for crude globally.
As far as demand, that side is behaving exactly as anticipated when the “dollar” first shifted back in June (and which the credit markets were increasingly worried going back to November 2013).
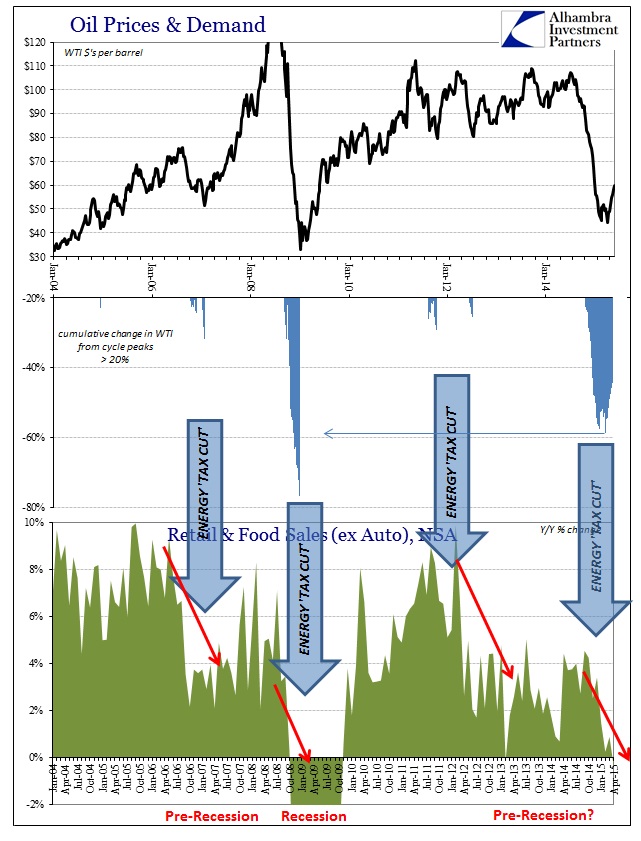
With consumer spending, at least, looking more and more like a recession that would be consistent with this type of behavior in all prior episodes. Economists still want to see falling oil prices as some kind of stimulative “tax cut”, and that may actually be the case if the global and US economy existed in a vacuum (ceteris paribus), but that substitution is far superseded by the negative economic pressures that are causing oil prices to decline in the first place.
The more immediate effects of supply falling to meet demand are, as recent data suggests, still in process. This is a multi-stage progression where certain pieces are self-reinforcing, which is concerning because of how oil production and activity itself has been one of the few bright spots in an otherwise dismal trend overall. Lower end demand leads to price collapse which leads to lower production, and then even less demand and so on. Monetary theory thus seems plausible by interrupting on that reduced demand in the first place (assuming that it could ever get the timing right), but, again, demand isn’t falling because demand is falling – there is an overarching reason that cannot be solved by a fifth QE (and may be even related to its four antecedents). The economy overall is getting smaller and everything has to adjust.
The basic economics of crude tends to confirm that the economy has already gone through at least one “cycle” smaller, and now we have to figure out whether that was enough or if there is still more reduction to come.
Stay In Touch