
Last week, Goldman Sachs reported a nearly 30% drop in FICC revenue, far and away the largest decline among the major money dealers. That compared to -10% for JP Morgan’s FICC, and -9.3% at BofAML. There are a couple reasons for the disparity but the largest, at least what you can make out from the bank’s balance sheet, traces back to QE3. Based on swap spreads, among other indications, it seemed very likely that major dealers went into overdrive on taking fixed in the wake of QE3 and then QE4. Of all the major dealers, Goldman seems to be the best candidate to have taken that approach. Though it isn’t explicit in its balance sheet presentations and figures, the dots connect easy enough.
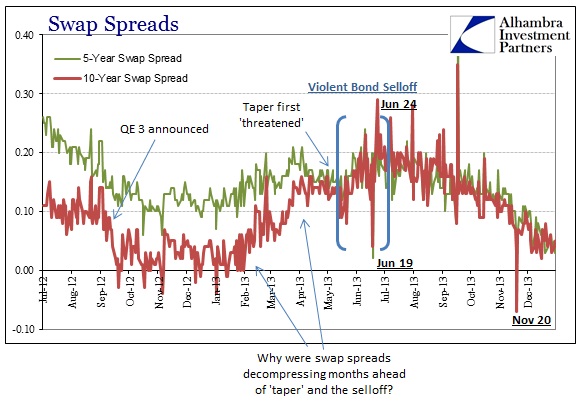
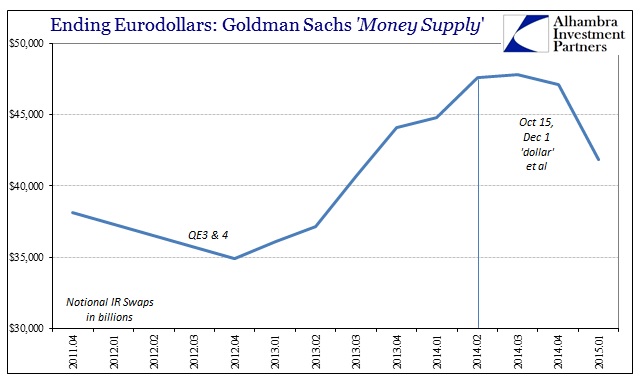
Where other banks were far more tepid about IR swaps, in particular, in the middle of 2013, with very good reason, Goldman continued to write them until June 2014 (same caveats apply; 1. notional values may be interpreted in several ways and I am making an assumption, though I feel one that is very reasonable by broad context, that changes in notionals are equivalent to changes as a form of liquidity or “money” supply; 2. Notional values do not denote any quantity of “dollars” but rather a relative measure of risk factors or traded liabilities that accomplish “dark” leverage). That may offer one explanation as to why the “dollar” problem in the past year has been so amplified. The one dealer that was at least persistently active in offering balance sheet risk capacity, wholesale “money supply”, even throughout the taper drama suddenly stopped and then reversed severely in Q1 2015.
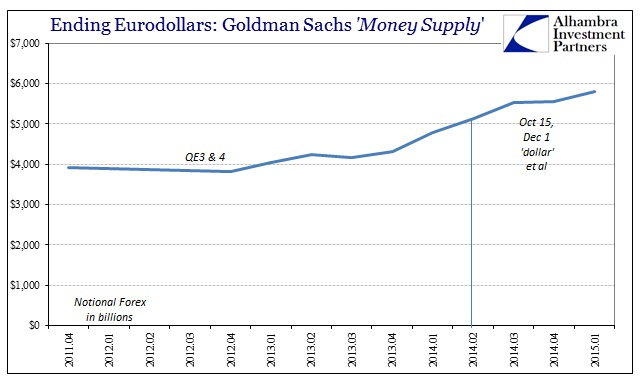
In addition, the total forex capacity from Goldman, which, like the other dealers, had been increasing in this tightened “dollar” environment, also has diminished (in this case, a change in upward trajectory). That would seem to leave the eurodollar wholesale system without much offered capacity from the dealer network, which again confirms that interpretation derived from so many other indications.
I think it is important to note and analyze these anecdotal changes in individual bank construction and proclivities as they provide needed granularity about the overall wholesale decay. While each individual dealer takes on its own judgments about the immediate environment, as a whole the derivatives view of wholesale/eurodollar capacity is consistent with what has been observed, again, of the “dollar” and related financial prices and factors.
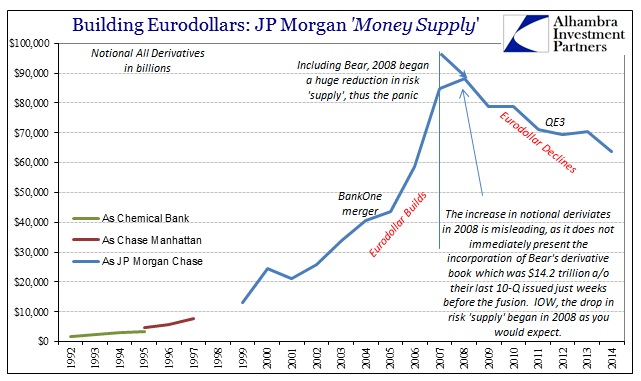
The Office of the Comptroller of the Currency publishes a quarterly compendium of bank derivatives as reported in call sheets. While it provides only an aggregation of domestic banking operations in terms of derivative supply, it is quite useful as a basis for analysis.
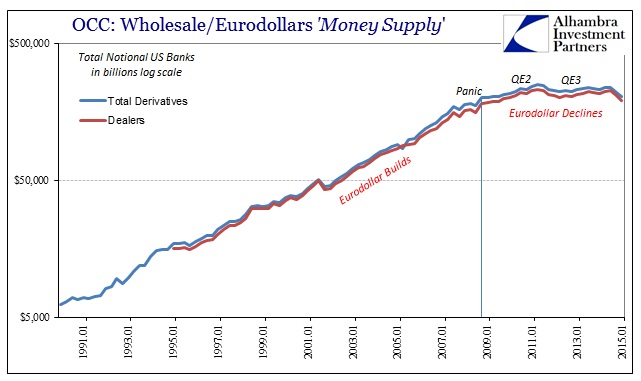
What is most obvious about the trajectory of derivative “supply” dating back to 1990 is its steady (or nearly so, given financial events) rise until the panic in 2008. Unlike individual banks I have presented so far, the panic itself is less prominent, but no less so in the eurodollar retreat period especially from 2011 forward.
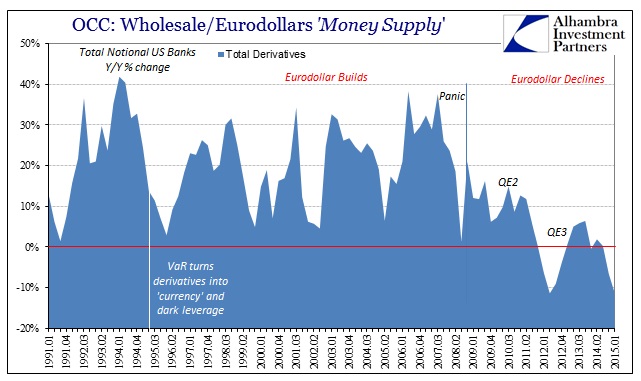
There are a couple reasons for that, especially in that total notional values are dominated by interest rate swaps. Credit derivatives, importantly, were “only” $16.4 trillion at their highest point in Q1 2008; that compared to $129 trillion in IR swaps. While IR swaps are certainly important components to this wholesale supply regime, credit derivatives, especially CDS, were of a far more heightened state especially in the last few years of the housing bubble (the mania). CDS were, in that respect, an amplified form of super (dark) leverage as they applied directly and heavily to “capital” calculations and hedging into VaR and vega in a way that IR swaps could not (and cannot).
Thus, the panic in 2008, starting in late 2007, is more properly viewed as a means of CDS retreat than overall IR swaps even though swaps growth slowed in tandem.

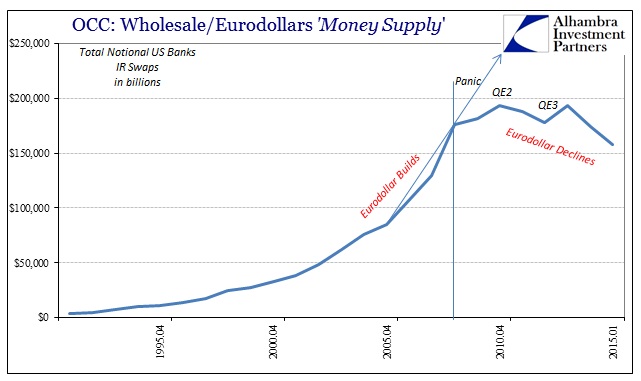
The significance of the panic in terms of CDS isn’t just that total notionals pulled back slightly in Q2, after Bear failed, but that the decline was in reality far less than the growth path that existed just prior to the inflection. The system “required” continued exponential growth in order to service that growing leverage supply, and the deviation, amounting at that time to a small decline, from that growth path was then quite severe and damaging.
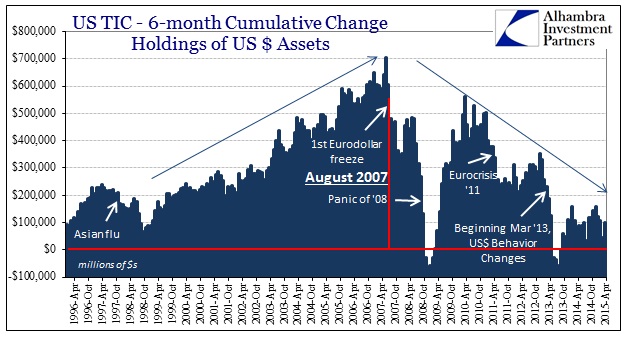
The second part of the panic that doesn’t immediately show from the OCC’s figures is the foreign influence on bank balance sheet “supply.” We already know from LIBOR and other interbank indications that the actual panic was centered on London and the eurodollar end of the “dollar” system. By combining the OCC’s figures with the BIS’s global estimates (that extend beyond eurodollars) we get that sense of geographic divide in the first part.
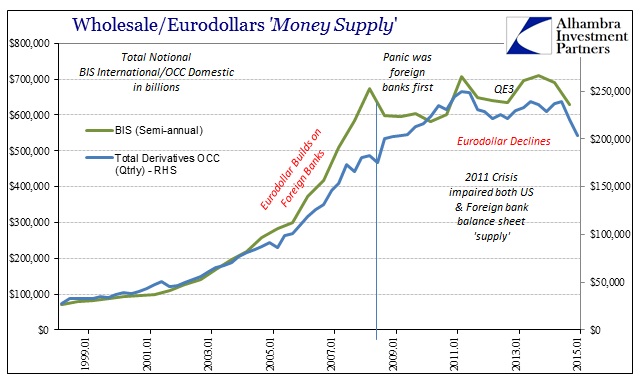
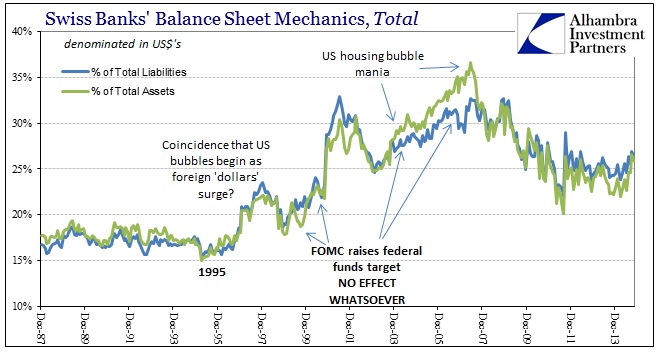
Like the data from the Swiss banking system, the relative comparison in growth of the foreign component of this “dark” leverage showed how much it was overseas bank capacity that was driving eurodollar growth and mania in the last years of the cycle toward the ultimate peak in August 2007. The retreat in balance sheet capacity was far greater on the foreign bank end than from the domestic banks. That, too, matches observations from a broad set of interbank and money dealing signals, not the least of which was the massive rush to the Fed’s swap “window” from foreign central banks.
Ultimately, however, it was the 2011 crisis, ostensibly in common perception as exclusively euro and European, that combined both foreign and domestic retreat. In other words, there was some additional capacity being trained toward rebuilding the eurodollar system, at least domestically, as it was prior to the panic but that the break in the middle of 2011 ended all potential for restarting the global “dollar.” Since that break came immediately after QE2, it shows the utter impotence of monetary policy in actually factoring toward the real “printing press.”
Some banks “left” before others, but what is clear is that Dodd-Frank is not the main influence here at least as far as the actual decline. Instead, there are numerous financial and systemic impairments that have created impenetrable obstacles to reconstructing as directed (by Dodd-Frank and global monetary policy). Some of those systemic breaks are more apparent, such as European banks bloated with euro-denominated bad debt, including PIIGS sovereigns, are not going to be able to readily supply anything let alone “dollars” and “dollar” risk absorption factors. Some are less so, like collateral concerns especially in what is still a huge and tremendous shortage that has not abated really since 2007.
In short, all these numbers and graphs point in the same direction; that the global wholesale banking model, especially its eurodollar core, is fatally compromised by factors far beyond the control or even influence of central banks. Yet, for that, central banks and related legislation, especially Dodd-Frank, have had the effect of denying any other form of capacity that might take up the slack left behind from this reversal. “They” keep appealing to what seemed to work in 2006, when in fact it never really did without exponential growth and now is untenable and unstable at any level.
Stay In Touch