
If the world is poised upon the precipice of “deflation” and the ugly economic consequences of reduced “money supply”, at the middle of all that are the primary dealers – still. While it is technically correct to claim that the Fed expanded its balance sheet to $4.5 trillion, with $2.4 trillion left after autonomous factors for bank “reserves”, that actually means very little without almost perfect assistance of the primary dealers. The idea of QE was that buying securities from these dealers would leave them no choice but to turn around and use some of those reserves in either money markets further on, or in outright purchasing of other risky securities. And if those reserves were further offered into money markets, such cheapening rates would spark the tide of risk taking or some forsaken “animal spirits.”
Dealers, for their part, don’t really make money from holding securities; in fact, no financial institution does as spreads are simply too thin. The wholesale world is a leveraged world, leaving leverage in all its forms as the basis of both liquidity and derivative math-as-money. We can only infer leverage available through certain opaque and imperfect windows. One of those is primary dealer holdings of UST coupons.
Conventionally, commentary assigns dealer holdings as they would any other portfolio, as speculative trade – as in recently “short” UST bonds on the expectations that the Fed would hike rates (and further that any rate hike would actually matter for something). While that might play a role in some settings, overall it doesn’t affect dealer holdings in that way. Here are the latest figures for what primary dealers reported in their coupon inventories:
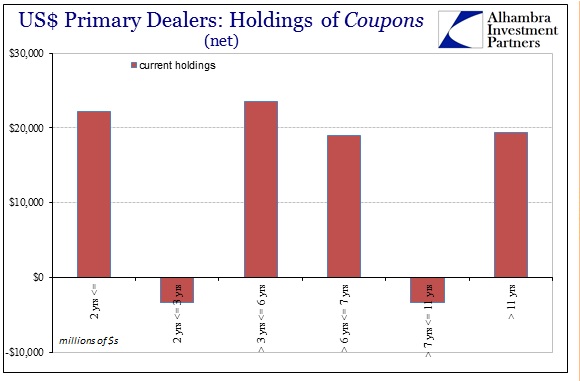
From the purely investment standpoint, it wouldn’t make sense that dealers are in the aggregate net short the 10-year (in the 7-11 reporting bucket) but long the outer maturities. Likewise, why would dealers be net short 2-3 years but long 2 years and less? The reasons for holding patterns like this have nothing to do with interest rates or even monetary policy as it is generally understood. These are technical factors that relate to UST’s and primary dealers as major collateral conduits.
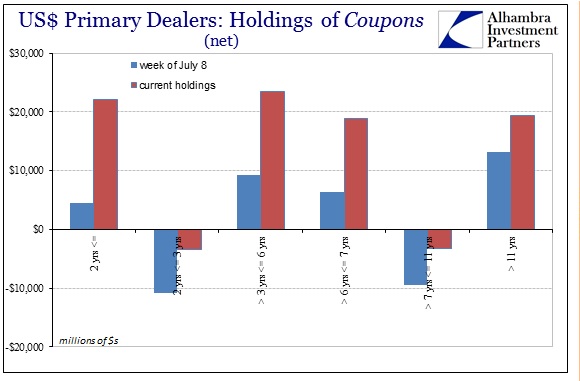
This technical patterns has prevailed even from earlier in the summer before the general and global liquidations got underway (before July, turmoil was more intermittent and seemingly overseas).
Looking at dealer holdings in this fashion, however, clouds the collateral issue. Instead, viewing it in the aggregate (all coupons) by chronology reveals the trends of illiquidity that have been an almost constant feature for getting close to a decade now.
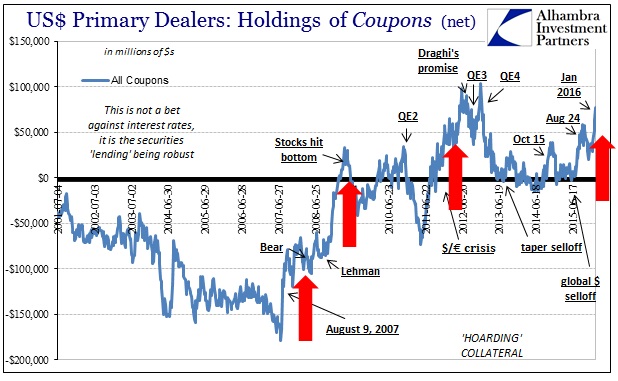
As I wrote last March, dealer holdings from this perspective allow us to calibrate dealer proclivities in terms of generalized views on wholesale liquidity:
Dealers exhibited a massive net short position in coupon UST all the way until the crisis hit…The short position indicated that dealers were extending liquid collateral into the marketplace. Thus the opposite, where dealers held less net short or even net long, meant dealers removing and “hoarding” collateral.
With that generalized view in mind, the track of dealer inventory follows spasms of illiquidity almost perfectly. The scale of the change after the panic was immense, as dealers were net short (supplying) $178 billion in coupons in the middle of July 2007 but wound up net long (hoarding) $33 billion by early April 2009 when it all finally relented (from FAS 157 changing mark-to-market). By the time of QE4, dealer’s net long went as far as $100 billion, for a total systemic swing of almost $300 billion. That’s a huge amount of liquid collateral that went from easily available to beyond hard to find.
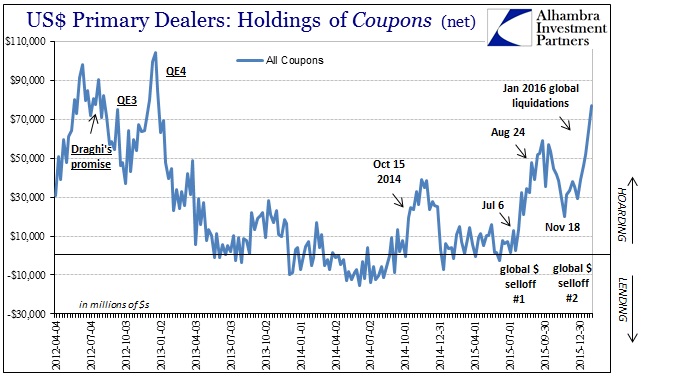
What we find in January 2016 is both a replica of the sharp rise into late August 2015 and an increasing level that appears as if the conditions of 2011 might likewise be replicating. Dealers net long position in coupons is in the latest update the most long since QE4 was initiated. Further, it does increasingly “feel” like something of 2011 levels of dysfunction in global liquidity, including the introduction of more financial elements in this latest wave. Going back to the middle of 2014, you can observe at least three successive waves of hoarding, each increasing in intensity.
Even though the accompanying surge in repo fails has de-escalated in January, the ripples of illiquidity only continued as they so often do. It is impossible to separate cause and effect, though in many ways that doesn’t matter as these kinds of imbalances speak to feedback mechanisms where cause and effect bounce back and forth to the point they are inseparable. In other words, it just indicates great disorder which helps us confirm what we long suspected of the eurodollar system and collateral. From November:
With fails rising through October, I think it reasonable to suggest that internal wholesale eurodollar mechanics are still easily disturbed. Further, we don’t quite know yet how swap spreads and bank desk withdrawals will impact this situation fully, since it takes some time for all that to work on through into all the separate and disparate wholesale pieces.
At least in one respect, these dealer reports corroborate easily the behavior of the junk bubble including, it would seem, issuance degradation. Lack of fully available and flowing liquidity in repo in whatever disjointed form would certainly act negatively upon leveraged loan prices as well as institutional portions of junk and high yield. That has been the one constant through the whole of October; where stocks have enjoyed a tremendous rebound, the junk bubble cannot catch even the smallest sustained bid. It had already suggested that the last “dollar” wave had not dissipated, and dealer hoarding goes further in supporting that idea.
I think that is the usefulness of this data and this kind of data. It doesn’t tell us anything specific about certain conditions, rather it confirms the overall weight of suspicion derived from other second and third hand accounts about the dysfunctional central mass of eurodollar internals. From that point, we can derive more reasonable speculation and informed analysis about what that might mean for markets as we progress into this “supercycle.”
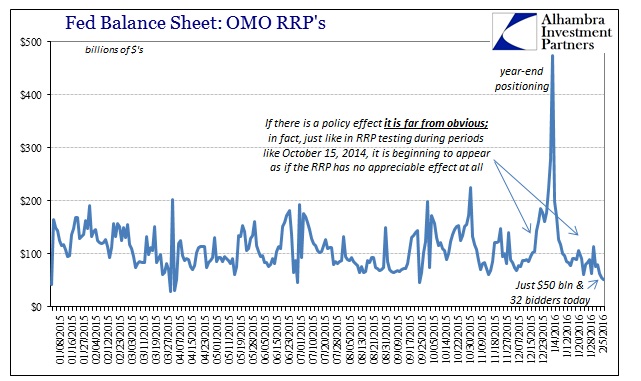
If there was an added bonus to these figures, it would be in the offer of further evidence that the Fed really doesn’t know what it is doing. Collateral sustainability (potential shortages) was one of the primary tasks of this “immense” reverse repo (RRP) offering. When the Fed first issued its monetary inflection decree in December they made a special point of highlighting guidance as the supposed power of the program. No matter how much illiquidity we have seen since the middle of December, however, the RRP has been a rounding error, an irrelevant, bureaucratic art project focused on nothing useful in particular. As I noted last week (subscription required):
I can’t help but marvel at the Fed’s RRP program. If you recall upon announcement of the “rate hike” the FOMC was expecting considerable activity and effort; perhaps as much as $2 trillion. It never occurred, of course, but I seriously doubt as if the FOMC expected the pittance that the RRP has performed especially of late. January’s month end wasn’t even noticeable at just $114 billion, but in the past couple of days the balance has tumbled to less than $60 billion; with just $50.9 billion today among only 32 bidders.
If dealers are “hoarding” tens of billions in UST collateral there should be, through rehypothecation at least, robust business at the RRP to resolve or seriously help resolve any shortfall. Instead, there has only been general and global liquidations with January in many ways far worse and more widespread than August. The response in the RRP? To fall to just $50 billion?
Dealer hoarding of collateral, then, gives us more robust evidence that the market continues to be disrupted by internal wholesale imbalances (and not just repo, as collateral is defined through several important outlets), these eurodollar conduits that support (or don’t) the “global dollar short”, and that the Fed is both clueless and unable to offer anything other than their own confirmation of this ridiculous set of monetary circumstances. SOMA is a potential “silo” of collateral offering perhaps $2 trillion or more and yet there is good evidence of a collateral shortage and that such shortage is related to the prevailing tendency toward unwelcome disorder. It renders yet closer to the final verdict that the eurodollar system is in desperate, intractable trouble and that the Fed can’t do anything about it.
Stay In Touch