
The February payroll estimate for the Establishment Survey was 242,000 with upward revisions to December and January, so we are told the labor market is surging once more. Last month when the Establishment Survey suggested “only” 151,000 (before revisions) it was taken as disappointing even though there is statistically no difference between 151k and 242k (a 90% confidence interval leaves out a lot of, well, confidence in the exact number). The saving grace last month despite the “weak” headline number was the purported surge in wages, which was immediately seized upon as the long awaited signal for “oveheating.” In February, though, where job gains have been taken as inordinately better, wages collapsed. Statistics.
In fact, average weekly earnings (combining wages and hours) fell by the most in the relatively short record of that series dating back to 2006. That suggests, strongly, the wages gains from January weren’t and the wages disappearing in February still more confirmation of the dangers of statistical over-interpretation. There are seasonal artifacts (and bias defects, really) that are on full display in these numbers, but that only makes it into the mainstream on the one side.
Last month for the January payroll report, one Reuters reporter wrote:
U.S. employment gains slowed more than expected in January as the boost to hiring from unseasonably mild weather faded, but rising wages and an unemployment rate at an eight-year low suggested the labor market recovery remains firm.
The same reporter this morning suddenly notes “calendar quirks” in the wage data even though the same calendar quirks were present in January’s estimates on the way up:
The only blemish in the report was a three cent drop in average hourly earnings, but that was mostly because of a calendar quirk.
That $0.03 drop in wages translated weekly earnings from January’s $878.15 to just $872.04 in February, again the biggest reduction on record (and even worse as if wages were really growing the relative change is not compared to last month but what February growth “should” have been). In short, “calendar quirks” were seasonal adjustments that in January boosted the wage rate though that wasn’t part of the story, but statistics being what they are only means that those adjustments have to be “given back” the next month unless there is actual growth; making them the story on the back half when it is that latter summation that truly counts. The seasonal adjustments for January across a large range of economic accounts were similarly robust (retail sales most conspicuously), meaning that the behavior of wage estimates here are a likely preview of what those February seasonals will be.
With wages fizzling in the seasonal statistics, the only other potentially significant part of the increasingly irrelevant payroll report is the labor force. I have been pointing to the lack of labor participation for years now as a contradiction to the mainstream narrative, especially “overheating”, suggesting that a true economic growth wave would build starting with a steady increase in the labor force. After stagnating for most of 2015 (not counting January’s likely discontinuity), the labor force finally grew over last year’s last quarter plus the two months so far of 2016.
However, that growth wasn’t what you would expect of even the start toward overheating, rather it was an historic surge of unbelievable proportions. The BLS reports the labor force in February 2016 as 158.9 million compared to 156.9 million last September. In other words, as the manufacturing recession deepened and even troubling indications for services spending and activity (not to mention GDP) all alongside almost continuous, serious market turmoil and uncertainty, the labor force expanded by 2 million. That gain is so large in such a short period as to have only occurred four other times in the series dating back to 1948 – and one of those was the huge 2 million discontinuity in January 2000.
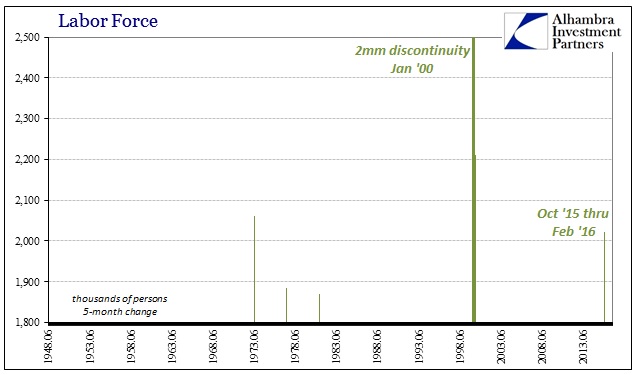
Adjusting for the size of the labor force, on a percentage basis, the increase over the last five months of estimates is still larger than anything, by far, since 1984 (not counting either January 2000 or the discontinuity in January 1990).
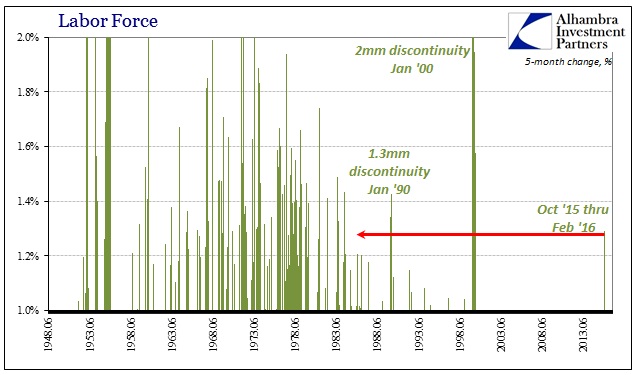
There is nothing about the economy since the latter half of 2015 that would suggest a massive change in the labor force, to a historic degree, from apathy to suddenly looking for work. In 1984, that made sense inside the economic context where actual recovery was inarguable, visible as it was everywhere and to such a heavy degree, especially since it was the last time we saw such growth. Economists and policymakers might like to make such a comparison, and have in more measured framing, but it just doesn’t correlate with anything else – particularly the ongoing and gaining “manufacturing recession.”
To my mind, then, the only realistic scenarios are either there was indeed a rush into the labor force as people suddenly decided they better look for work while they still can, or it is yet another statistical artifact over-amplifying minor changes. Because it was so immense and so out of line not just in terms of our current economic condition but in anything seen over the past three decades (where there was artificial economic growth so far above now), I have to lean toward the latter possibility. Again, labor force confirmation would be entirely more convincing had it been building steadily over time rather than all-at-once; especially since this all-at-once occurred just as the fuzzy notions of slowdown coming only from overseas turned into admitted manufacturing recession and now worries over the service sector, all against a global backdrop of truly desperate conditions.
The January jobs report, then, was confirming wage growth but no headline compared to February that was no wages but confirming headline, though in reality no statistically significant difference one to the next. If the BLS suggested these numbers (apart from wages) in 1999, there would have been no need to question their construction or the meaning behind what are really just modeled variations. It made sense in the context of the overall world at that time, artificial as it might have been (but that is a separate issue). The bubbles then generated clear activity and GDP; retail sales were rarely below 6% month after month and there wasn’t even a hint of manufacturing recession. Even global economic turmoil from the Asian flu had visibly past.
In today’s context, the BLS numbers stand out when they were never designed to. I don’t think that is going to change which is why the payroll report is increasingly irrelevant. If the speedometer in your car reads 60mph when your engine is in idle and the vehicle barely moving, you don’t even think about stomping on the brake; you get the speedometer fixed. That situation is far less likely in the real world since speedometers are built on solid mechanical principles and parts; the payroll statistics, however, are modeled regressions of variation open to any number of biases, yet they are taken as seriously as any speedometer. In 1999, or even 2005, there wasn’t any pressing need to question those biases. Today there is, in no small part because they are really showing.
Stay In Touch