
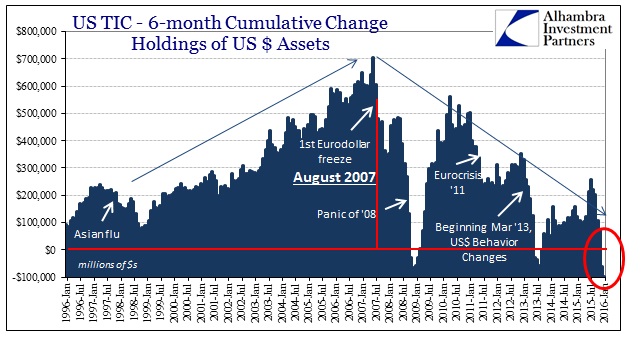
The “first” part of the TIC data update for January was relatively straightforward, especially since the scale of the net transaction adjustments in both December and January really did match what happened in January (crossing into February). The Treasury Department’s estimate for foreign holdings of US dollar assets were nothing short of remarkable in all the ways that were expected (unless, of course, you are fully committed to “the narrative” and thus find it increasingly difficult to suggest how any of this is really nothing to be concerned about). As noted earlier, the net “selling” of dollar assets, primarily treasuries, was intense owing to the involvement of the “official” sector. The second part is trying to figure out who or where it was, as there is a bit of discrepancy especially for January.
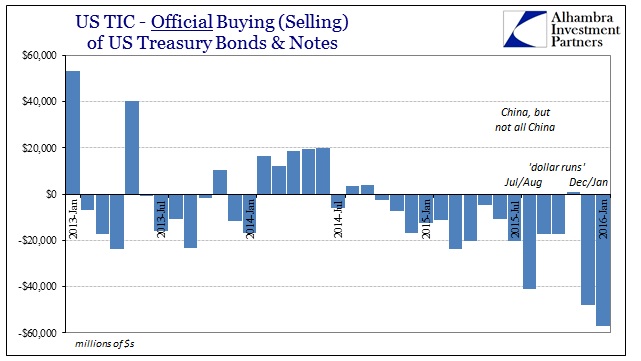
Since last July, encompassing both liquidations of what appear to me as a single “dollar run”, the scale of “dollar” funding issues is almost unprecedented. In terms of just foreign central banks, it was.
That does not mean all was well at the private end; far from it. In fact, the very scale of central bank “dollar” intervention can only imply that private “dollar” markets were a total and unequivocal mess, which is the predicate cause of the liquidations of especially January. That means, as per usual, central banks attempted to address the shortfall but were unable to work more than the contours (if that). Given that these TIC estimates show more than $100 billion in UST “selling” in December and January cumulatively and liquidations occurred anyway, we can reasonably assume that the funding gap was just enormous.
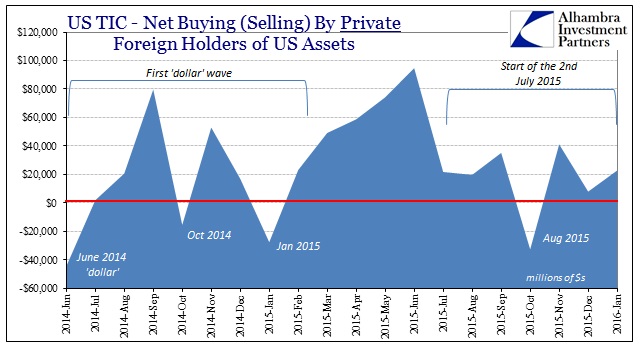
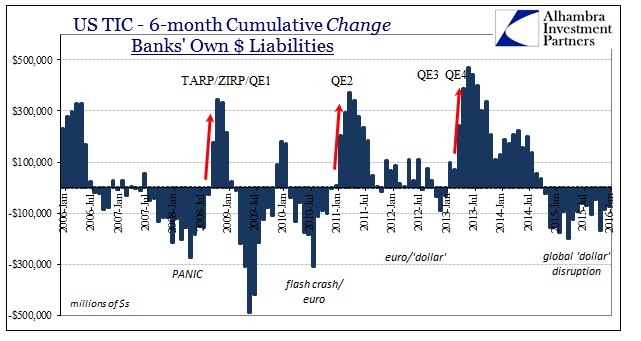
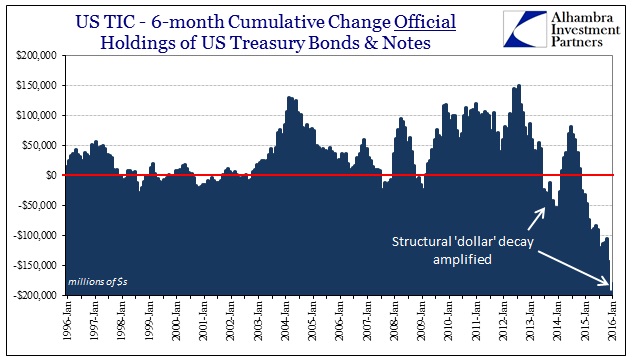
It might be at this point where it becomes confusing, as private “dollar” markets are far more than what is presented in TIC; whereas the emergency measures central banks have been taking (during this eurdollar decay period) primarily result here in “selling UST’s.” In the two charts immediately above, the private holdings of US$ assets have been rising in the past few months despite the return of liquidations. However, reported bank liabilities (“dollars”) have not, at least on a cumulative basis (there are quarterly flows and window dressings to account in this estimation; by and large, however, banks are continuously shrinking their reported “dollar” liabilities dating back, unsurprisingly, to the middle of 2014).
In short, the private funding market is far more than what shows up on TIC (especially swaps and equivalents) but when something does show up, that is typically the involvement of particularly distressed official countermeasures that never actually work at maintaining order. Therefore, “selling UST’s” is good evidence for the incidence(s) of “dollar” distress. Given the historic rate of the official sector especially since last July, we can assume a massive “dollar” shortage worldwide and thus explaining why global markets all fell in synchronized fashion (twice).
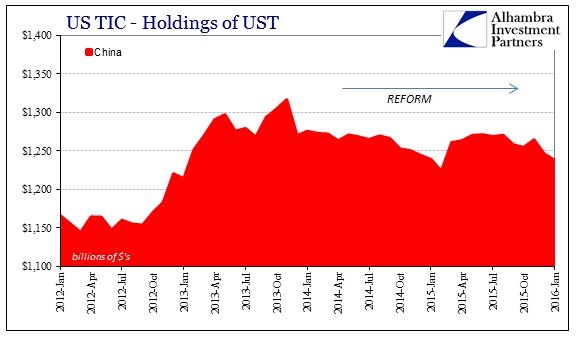
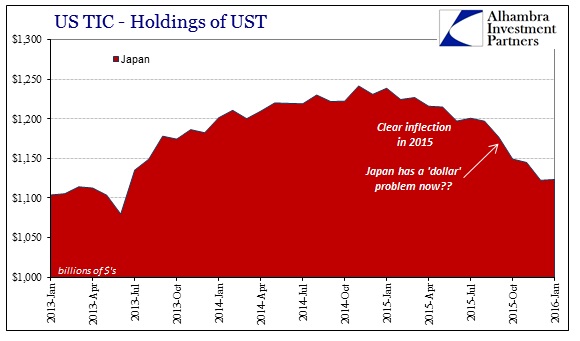
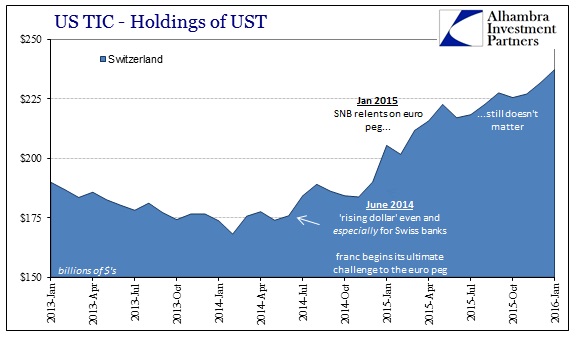
The net negative for official transactions in UST’s was at a record in December (-$48 billion) surpassed again in January (-$57 billion). The TIC series also provides geographic breakdowns of holdings, but it isn’t directly comparable leaving some guesswork and even discrepancies. For example, the country assignments for December largely add up: the two largest holders, China (including Belgium) and Japan, reported net declines of $62.7 billion. That was balanced by net “buying” in other locations, especially and importantly Switzerland.
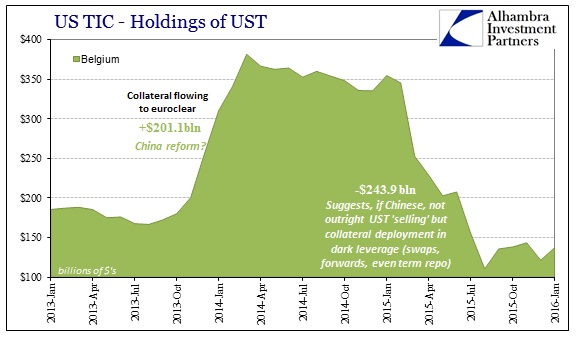
For January, however, despite an even larger net “selling” there was instead silence in the individual country specifics. China reported a decline in holdings of only $8.2 billion, while both Japan and Belgium reported increases of $1 billion and $15.8 billion, respectively. Where did the rest of the huge, record official “selling” occur?
The only other large holder of UST’s that showed a significant decline in January was Ireland, but the $12 billion in net selling in January was likely an adjustment or balance from the net $17.8 billion in buying the month prior. Even the “oil exporters”, a category which includes the increasing funding problems of Saudi Arabia, showed a small increase in January. To this point, there is no specific answer which itself suggests other means and methods (where “selling” isn’t actually or always selling).
When the Wall Street Journal reported early last week that the IMF was seeking more specifics about China’s forward and swap activities in currency (really funding) markets, that included what should have been an alarming estimation:
Some market participants estimate that China’s current holdings of forwards range between $150 billion and $300 billion, as the central bank has stepped up the use of such stealth intervention to support the yuan in recent months.
Now there are still factors that we don’t know about that estimate (starting with any guess on accuracy even with such a wide range) including what the PBOC does for its “usual” operations. In other words, if the PBOC is typically active at around $100 billion (for the sake of argument) and then is pressed to $150 billion in these emergencies, that is still a large intervention but nothing like accelerating to $150 billion from $20 billion or zero or even a net short. These numbers are simply huge, potentially, and because they are hidden deep within the bowels of the unobservable interior of the eurodollar system they aren’t easily appreciated.
For comparison purposes, the BIS in October 2009 calculated that the short-term funding gap of the “dollar short” limited to just European banks was $1.0 to $1.2 trillion – of that, $315 billion was filled by FX swaps and derivatives. So let’s assume a worst case where China’s central bank shot from zero to $300 billion in forwards and swaps. That would be on a scale of nearly the whole of European banks’ collective derivative funded “short” at the height of the precrisis era. The sentence I just wrote still does not even come close to recognizing the magnitude.
We can probably assume that the PBOC has done something less than that though without precluding the very real possibility it is as bad as described by the “worst” case. Even at a potential $200 billion, the intervention into what is really a private “dollar” shortage or shortfall is itself unimaginable. Further, the fact that we can’t locate the geographic position of the part showing up as “selling UST’s” might propose just these kinds of transformations. In other words, intervening via forwards is nothing more than a maturity transformation for whatever funding problems and imbalances; the intent is to fill the short-term, immediate hole so that enough time passes that whatever you do to accomplish the short run goal expires into more fruitful and sustainable funding conditions (because at that point, the “dollar” market has to absorb not just normal funding needs but also then the extra of expiring maturities of these past IOU’s).
The fact that “selling UST’s” does not immediately show up where it is expected (and like December) might suggest that there is even more going on than just maturity transformations. This “mystery” might suggest that China as the most pressured point of the eurodollar system has instead enlisted banking help in covering the shortfall via derivatives (dangerously getting banks to be more “short” the “dollar”). Though I noted above the continual and accumulated decline in global banks’ reported dollar liabilities, on a single month basis what was shown for January was unusual in the contrary. The first month of any quarter is nearly always a positive number (to somewhat though not completely balance the large decline always reported in the last month of preceding one) but January 2016 shows +$172 billion. That compares to +$126 billion in October and +$159 billion in July; it was the largest monthly increase since, tellingly, October 2014.
I should make clear that this is highly debatable on my part, consisting of almost pure speculation (I would argue reasoned conjecture, but speculation nonetheless). Not only are there many missing pieces, there is a lot contained here that still doesn’t quite add up. That isn’t necessarily unexpected given the nature of what we are trying to figure out here, but this is unusual even more so than the normal unusual. In terms of this possible discrepancy, it might be that the “official” sectors are moving collateral to private hands to essentially fund “being more short.” If that were an internal process, say from the PBOC to Chinese banks, that might account as to why China overall does not report significant selling whereas the “official” sector alone might.
We know the clock is ticking but we would like some idea about what that means if the countdown rolls again to zero. What this all might suggest is that the nature of the “dollar runs” is changing by circumstances; and not likely in a good way. Central banks are being forced to do more, a lot more, not just in quantitative terms but very likely qualitative fashion, too. That would not be a welcome development, especially on the scale potentially developing already; should it ever prove to be the case.
Stay In Touch