
US trade statistics for February improved in both exports and imports, but there are questions as to the reason for the reverse and whether it is actually meaningful. After abysmal performance in every segment and category in January, there was some give back in February including positive numbers in some places. That suggests that January’s trade activity might have been suppressed (financing issues?) and shifted somewhat into the following month (and then the 29th day may have added something further).
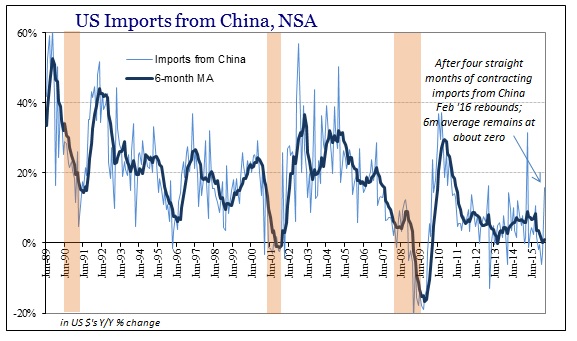
US imports from China, for example, rose 15.8% in February year-over-year after contracting for the four months prior. This variation, with sudden surges out of nowhere spread between very low or contracting months, has been the dominant feature of the past year and a half. Despite what seems like a very good number for February, the 6-month average remains barely positive at +1.1% because that +15.8% only replaces +10.8% from August (the last time there was a similar “good” month) in the moving average. The net result is the usual mainstream proclamations that the corner has been turned while Chinese industry is still stuck between capacity built for sustained +25% to +30% US import growth and the actual import level that remains at or even below zero if highly irregular in achieving it.
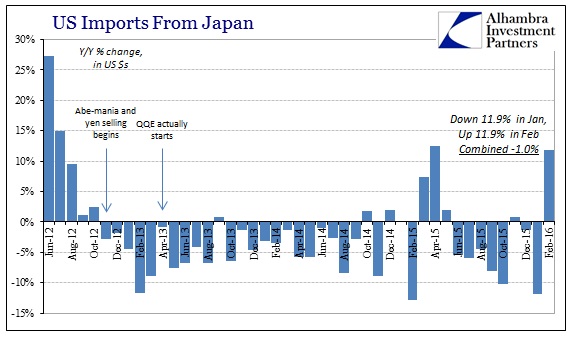
We see this two-month pattern replicated all over the data. Japanese imports to the US fell 11.9% in January, which was the second worst month since 2009. In February, however, imports rebounded by the same 11.9%. Combining both January and February, US imports from Japan fell 1% from January and February 2015 where import activity was already 6.3% less than the same two months in 2014. In other words, the slowdown continues at the same uneven pace which makes this whatever economic condition unlike anything we have seen before.
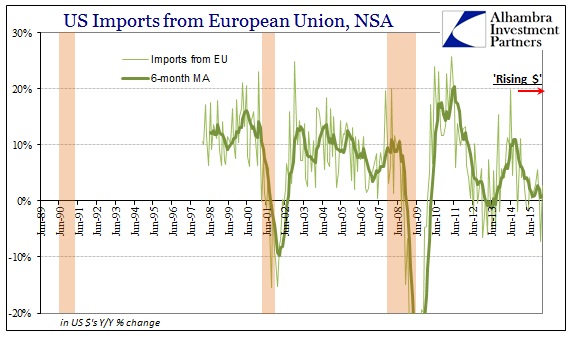
US imports from the European Union fell an enormous 7.3% in January, which was the worst month since October 2009. In February, imports from Europe rose 2.7%, leaving the combined totals for the two months 2.3% lower than the same two months in 2015. That is slightly worse mathematically than the 6-month average of +0.9%; in reality it again suggests the same zero or lower growth of the slowdown/recession despite the large variation month to month.
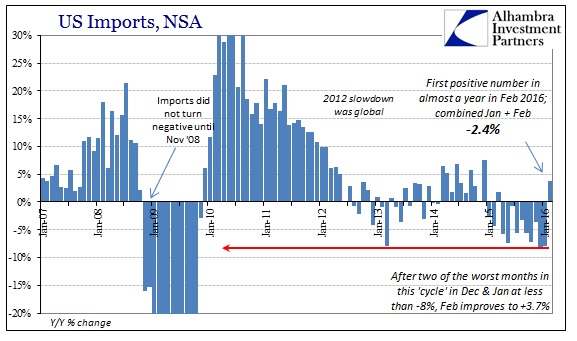
Overall, US imports grew 3.7% in February after two months of sharp declines. Despite the first positive growth in eleven months, the 6-month average remains an unhealthy -4.8%.
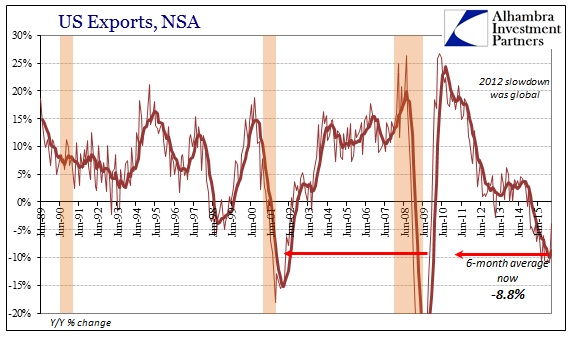
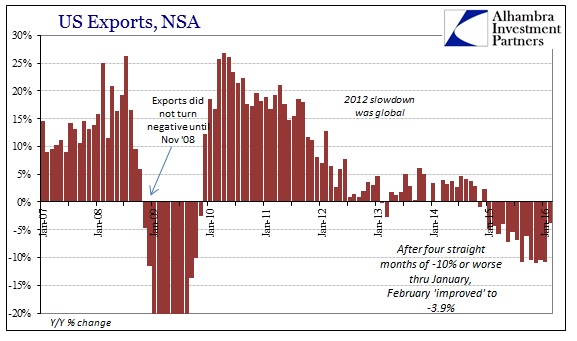
On the export side, the February results could not even manage a positive number. After contracting by more than 10% in each of the four months prior, February 2016’s export estimate is “only” -3.9%. The 6-month average remains drastically negative at -8.8%.
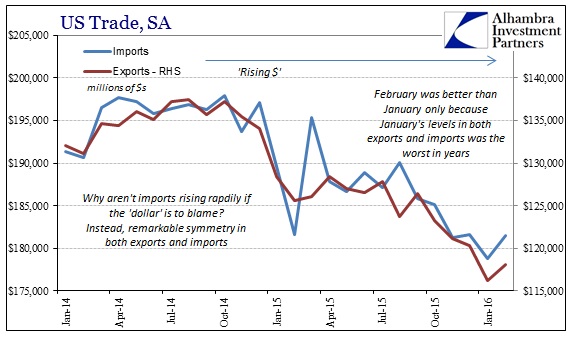
The seasonally-adjusted estimates demonstrate this disconnect upon these highly variable months, meaning that despite the flip in signs in February it really didn’t make much difference overall. January’s levels for both exports and imports was the lowest in many years, so the slight improvement in February was only to match November and December (which were the lowest in years before January pushed to a new reduction). What becomes clear is that nothing has changed, as this is the same bumpy and irregular downward slope that has been in place for nearing two years now.
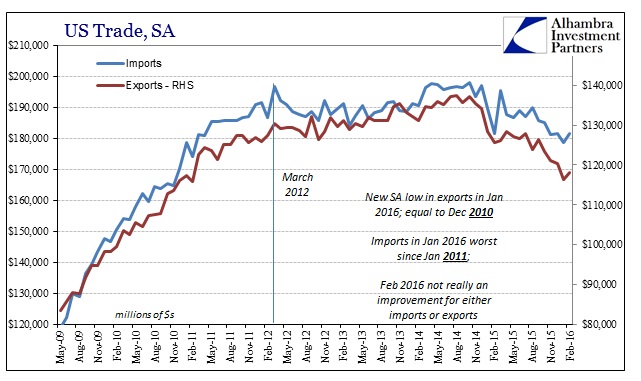
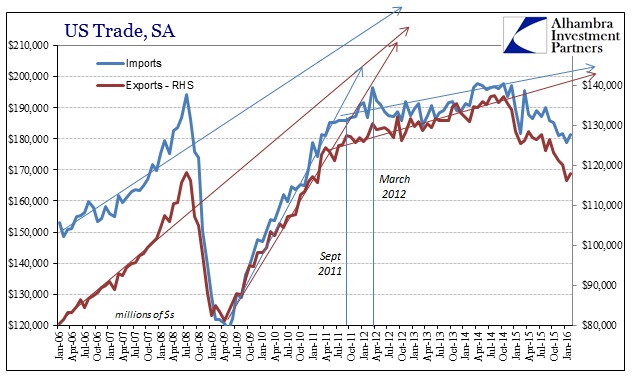
US exports, seasonally adjusted, hit their peak in August 2014 at $137.4 billion; imports topped out at $197.9 billion in October 2014. That means that exports have been falling for 18 months and are now down 14% (to February 2016) from that point. Imports, or US demand for global production, has been falling quite erratically for 16 months already and is more than 8% below that peak. Neither end of US participation in global trade shows any signs of reversing that trend.
That is the worst part of all this, and why in many ways it is a much darker possibility than straight recession even though the contractions are not quite at full-blown recession levels. The difference is time; in the Great Recession exports contracted sharply but limited to only 9 months (seasonally adjusted series) between July 2008 and April 2009; imports declined only one more month than that.
But that is just the period of contraction. As is plain in not just US trade but so many other economic accounts and statistics, it is just a continuation of the slowdown that first appeared in early 2012. In other words, this slowdown or paradigm shift is already several years old, only it hasn’t been noticeable in the mainstream because policymakers and orthodox economists have instead labeled it a “new normal.” And almost as soon as they declared it, this “new normal” of low growth switched signs on them so that what was supposed to be slow but seemingly steady growth turned in 2015 to slow but steady contraction (all “unexpected”). In other words, it was never a “new normal”, it was just something new.
What that suggests is, again, that these are not separate and distinct phases but rather a single trend or slowdown that has been in place for years going back to 2012 and even 2011. The clearest peak or sharpest point of inflection between the recovery that existed and what rolled over into 2012 occurs with March 2012, but there are signs of that shift as early as September 2011 – again that month needs no special introduction or review especially in monetary terms.
It is the same slowdown that shows up all over the world, including China and its industrial and manufacturing existence that closely relates to the state of US imports (which is only common sense).
The global problem is now one of time, specifically how this slowdown which has turned to contraction in so many places (including the US) only seems to linger far beyond what is traditionally observed of recession. Since recession is a temporary deviation from trend and this is no longer anything like temporary (with financial markets and funding indications suggesting there is more to come) what we are seeing here and in those other economic accounts is like recession but much, much worse. Since the eurodollar system, the credit-based reserve currency regime that has formed the basis of this global economic condition for decades is almost assuredly undergoing systemic reset (not by choice or intent) it makes sense that the financialized economy that it once supported would follow.
The US trade estimates for February suggest only that the global economy remains in this slowdown phase and likely still on the other side of zero. If the economic trend is negative, and so many data points outside the mainstream labor statistics propose only that, it means that the slowdown will continue because that is the actual economic trend or potential. It does not, however, preclude the prospect of recession within the slowdown as recession is again just temporary deviation from whatever trend; therefore it is entirely possible to have both the negative trend of the slowdown and a temporary and worse detour from it at the same time. The result of that would be an enormous cost in terms of lost time far beyond forsaken immediate output, whereas time is now by far the biggest negative factor. Lost time is not just opportunity cost of growth that should have occurred, it suggests economic problems of compounding further compound into greater systemic and social disruptions.
Stay In Touch