
On average, pig prices in China are about 50% higher to start this year than last. At about 25RMB per kg, prices are already above the seasonal surge that typically occurs during late summer. Last year, as pig prices started this huge run, wholesale pork jumped from a low of about 17RMB per kg at the start of April 2015 to around 24RMB per kg by late August. The year before, wholesale pork moved from 16RMB per kg to about 20RMB per kg during the summer months.
The reason for this massive spike in pork prices is Chinese supply of pigs, meaning the curiously shrinking inventory of animals. Pig farmers have exited the business in great numbers over the past few years as prices had declined (oversupply) and serious disease (porcine epidemic diarrhea) made smaller producers too inefficient to survive. The result has been an historic reduction in Chinese pig inventory, an ongoing problem from which there may not be a ready solution. From October 2014:
The current sow inventory is the lowest level in 4 years. It is expected that there will be more sows lost in September. The 10.0 per cent loss in sow numbers is about 4.5 million sows-more than 75 per cent (three-quarters) of the total number of sows in the USA-number 2 in the world for sow numbers. Hog production capacity has significantly been adjusted with the main cause being the loss of farm households.
The peak in on-farm hog inventory seems to have occurred in late 2013. Since then, household farms in particular have struggled maintaining not just profitable production but also widespread and easy access to credit. While there continues to be a complicated intersection of factors that have reduced Chinese pork capacity, the fact remains that the reduction is historic and is now starting to impact Chinese households. Between November 2013 and September 2014, the loss of pigs (sent to market) was about 5.8% or 26.7 million – about the size of Canada’s total annual pork production.
Pork reductions continued into 2015 and at an even sharper pace. By August 2015, as pork prices began to rise significantly, Chinese were faced with having to import hogs and pork as supply actualy fell below demand. The cumulative loss to last summer was estimated at 100 million head in the hog herd and maybe as many as 10 million in the breeding herd. That is the size of US, Canada and Mexico’s combined pork production. It is an indication of an unappreciated economic/financial shift in China and more unintended consequences of reform targeting banks and lending – the downward spiral of small producers being forced out in massive waves, sending their hogs into the market, depressing pork prices that much more and pushing even more marginal farmers out of the business.
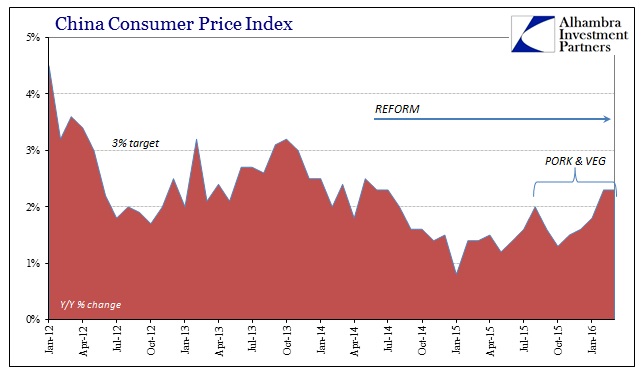
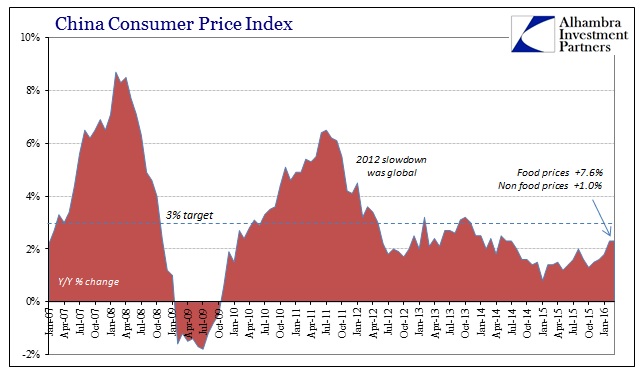
Pork remains the largest staple of Chinese food consumption, as reflected in its CPI proportion. The food segment of the official CPI “basket” accounts for 31.8% of the total index, with pork about one third of that. In other words, pork prices account for about 10% of the whole CPI. Year-over-year, the price of pork was up 28.4% in March, making up 0.64 percentage points of the 2.3% gain in the CPI. That was accompanied by a 35.8% rise in the index prices of fresh vegetables, which added another 0.91 percentage points and suggesting that it isn’t just pigs that have been removed from China’s domestic supply.
Absent food prices of largely just pork and fresh vegetables, China’s CPI would have only risen by 1.0% year-over-year in March. In other words, it presents yet another monetary quandary for traditional economists – they want inflation, desperately, because they dislike “deflation” that much more, but in this case China is not experiencing the kind of inflation they wish to find. Instead, this “cost-push” version is actually just another negative economic factor in a system with no shortage of them.
This is the second month in a row for potentially troubling food inflation, which risks further upset:
“If households have to spend more money on food then they may cut back in other areas,” said James Laurenceson, deputy director for the Australia-China Relations Institute at the University of Technology Sydney. “With household consumption now driving economic growth, that’s a risk the PBOC would be keeping a close eye on.”
It is perhaps more accurate to say that “household consumption” is not so much “driving economic” growth as instead being its last and only hope (and a long shot at that). When food prices surged last month and pushed the CPI also to 2.3% and the highest since 2014, a good part of that was blamed on the Lunar New Year where the Chinese “binged” on food, as well as the usual “cold weather.” It was expected that food prices would eventually calm, if not starting with March. If food prices instead continue to rise then it would again only add to the economic woes of trying to deal with past monetary intrusiveness.
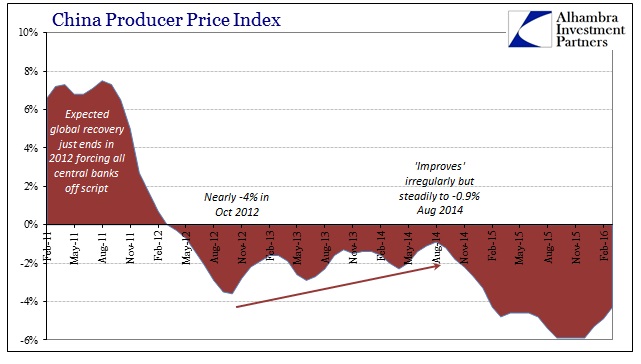
At the producer level, China’s PPI rose month-over-month for the first time in almost three years. Year-over-year it was -4.3%, the “best” estimate since February 2015. The suggestion has been taken that this represents yet another possible bottom signal about Chinese economic fortunes. It seems far too premature to make any such assertion especially since even at -4.3% that is significantly worse than the period before the “rising dollar.” From April 2012 thru October 2014, the PPI average -1.9% and at one point in 2014 it even appeared then as if Chinese industry had also hit bottom. The PPI estimate for August 2014 was just -0.9% after having been as low as -3.7% back in October 2012.
Further, the effects of December and especially January’s surge in Total Social Financing and lending (especially to companies just to stay afloat or restructure debt) have likely not yet faded, which would potentially skew more recent months. It would suggest much reduced pressure especially in terms of Chinese firms having to discount less, and less product, to attain sales (and thus cash).
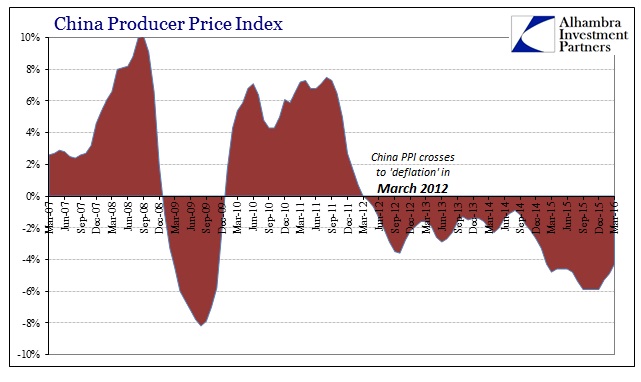
That view is all the more plausible given the shift in the PPI during some of the worst economic months for China in decades – the PPI started to improve in January when every other economic account proclaimed widespread weakness over and above the now-usual slowdown. From there, the relevant question to ask is whether that represents an actual inflection in overall direction or merely a change in individual circumstances within that overall direction.
The October 2012 to August 2014 period provides a useful guide. The PPI version of the industrial economy found a seemingly steady improvement but only in relative comparison. Even though the PPI had rebounded back above -1%, that only indicates that industrial oversupply was less bad than maybe it was in late 2012 when it seemed truly bad – but it was all still bad. The PPI continued to be negative and contracting the whole time, meaning individual circumstances had shifted but the overall trend unfortunately had not. Negative “inflation” calculations lasting two years or more can only indicate a truly fundamental alteration (unlike orthodox economics, that could actually mean a positive transformation if “deflation” were occurring due to some beneficial process; in China, that hasn’t been the case since “deflation” is occurring due to oversupply rather than efficiency).
The same was true for the CPI at roughly the same time, as in late 2013 the index was above the 3% target in consecutive months that September and October – but only those months. The vast majority of the time since June 2012 when the CPI fell below 3% for the first time this “cycle” it has remained significantly below. It is why you go looking into pig populations, breeding herd counts, and the seasonal behavior of Chinese wholesale pork markets, to analyze below the surface and the headlines to figure whether trends are changing or just individual circumstances.
Stay In Touch