
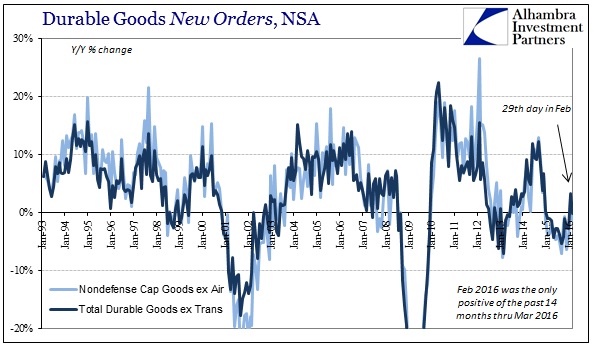
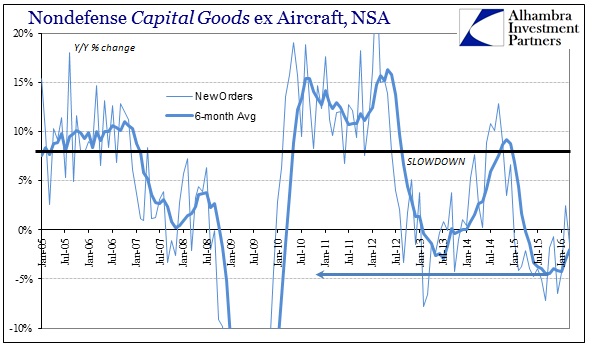
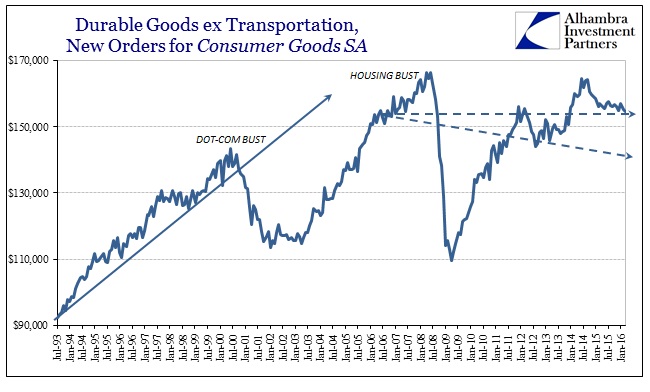
Without the assistance of an extra day as in February, durable and capital goods orders and shipments returned to the usual contraction. As is typical for this part of the slowdown, these are not huge declines but merely the continuation of contraction now stretching into a second year. Durable goods orders (ex transportation) were in March 0.23% less than March 2015, which was already 1.08% below March 2014. The “stacking” of contraction in capital goods has been more extreme, with new orders in March 2016 1.4% less than March 2015 and 5.1% less than March 2014.
It is the combination of contraction with enormous gaps of time (lost compounded growth) that is the biggest problem and concern. The effects of this latest part of the slowdown show both of these serious deficiencies; because of this contraction portion now lingering fourteen months, capital goods orders in March 2016 were also 4.5% less than March 2012. And because of that years-long slowdown, the current estimate is only 1.99% above March 2007, which is basically no growth despite nine years’ time.
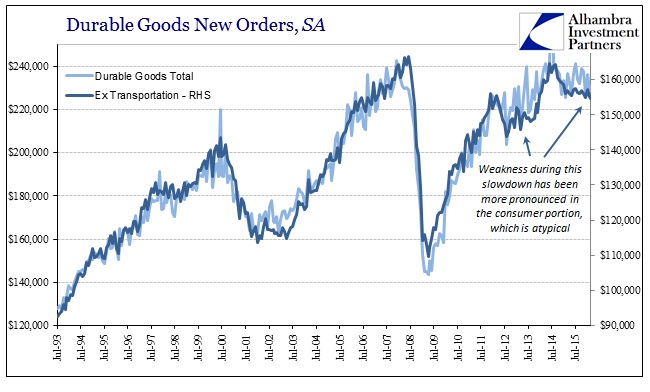
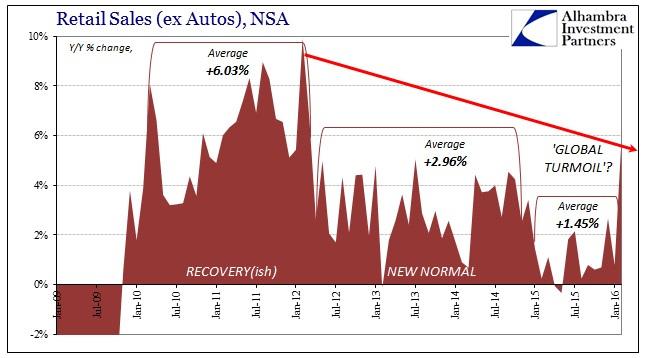
It is consumers and consumer spending that is leading the weakness in both sections of the slowdown – the initial decline in 2012 and then its renewal in 2015 (assuming that the “bump” in 2014 is valid, which in my view is increasingly in doubt). Comparing durable goods ex transportion (consumer goods) to overall durable goods orders shows this sudden departure. In prior cycles (with data only going back to 1992 in this version of the series), there was no discernable daylight between overall durable goods activity and that derived from the consumer-focused portion. In early 2012, however, the consumer segment is clearly a well-defined drag; and it repeats again throughout 2015.
With durable goods orders for consumer goods hitting a new recent low in March (seasonally adjusted), it raises even more questions about the validity of the recovery narrative and especially the labor statistics that narrative depends upon almost exclusively.
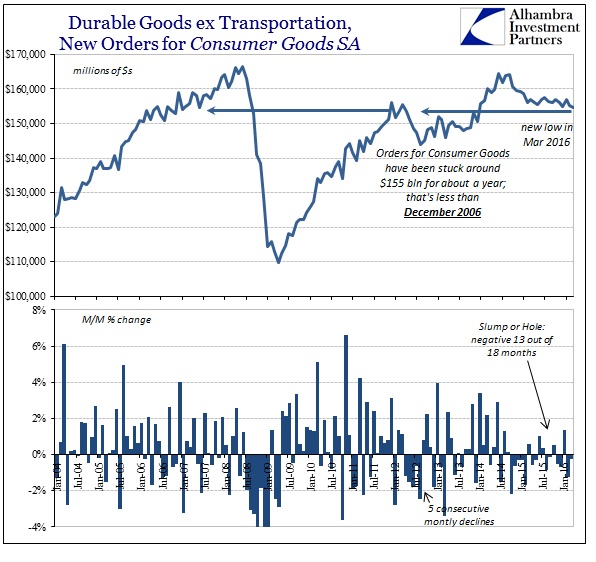
It also completely erases the idea that low oil prices were going to deliver some “tax cut” effect even considering lags. It has been eighteen months since oil prices suffered their largest declines and every indication for the health of the US consumer and spending activity only suggests further and continuing strain. As we have seen elsewhere, the reduction in durable goods orders is undoubtedly the ongoing adjusting response to the inventory that has accumulated as consumer spending only slows.
All of that suggests that the slowdown continues to gather and accumulate while still leaving intact, unfortunately, an increasing recessionary imbalance due in most part to consumer weakness. The idea of “overheating” (or even wage and employment gains) remains entirely elusive. Economists continue to suggest the economy is much better than Main Street thinks, but there is far more data in the shape of durable goods which only suggests both serious malfunction and an increasingly precarious state.
Stay In Touch