
The US Treasury yield curve is flattening again, with parts finally in 2016 surpassing the bearishness exhibited to start 2015. The mainstream is just now starting to notice likely because unlike last year there are no longer credible excuses to simply wish it away. “Transitory” is not a word you find much anymore, replaced instead by reluctant and forced acknowledgement that there is real economic peril here.
Bearishness in the yield curve is not something new, however, only the notice of it. While risks to the economy are part of this shift in commentary, the Federal Reserve’s haplessness is as well.
“The yield curve itself signals that things are not good looking into the future and talking about recession risk,” Major said in an interview on Bloomberg Television’s “On the Move” with Guy Johnson. “The market is now ready for a long, long time with very low rates and it’s been painful because people have been expecting the Fed to do what it said it was going to do. The Fed really wants to hike rates but can’t.”
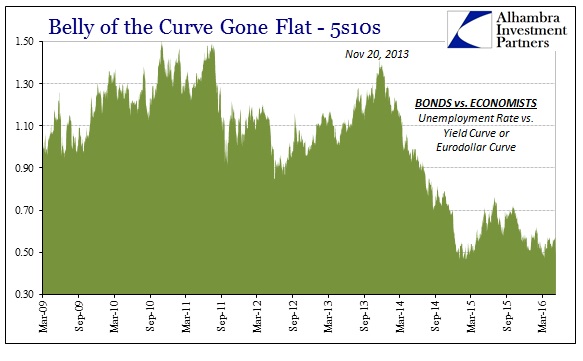
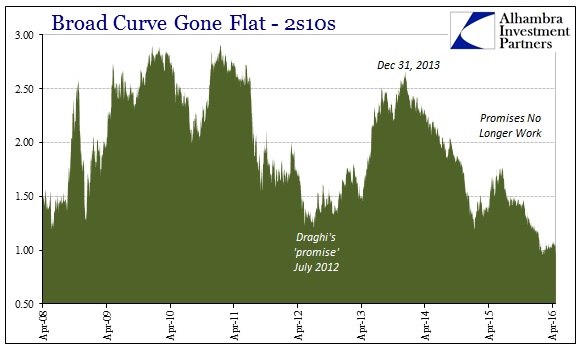
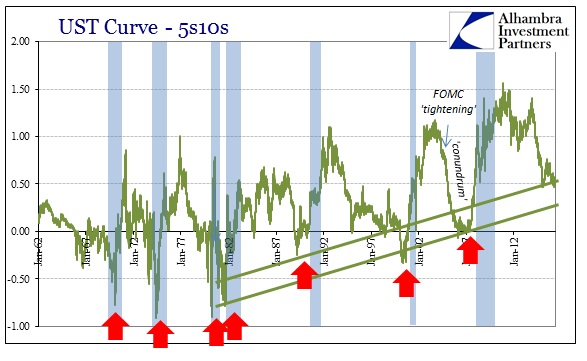
Flattening has been the operative condition going all the way back to late 2013; in the 5s10s dating to November 20 that year; in the 2s10s to December 31. That means that credit markets, echoing bearishness in funding, read the economic risks of QE3’s potential completion far differently than economists and policymakers. The latter group chose specifically to ignore markets in order to embrace the unemployment rate and Establishment Survey, while markets never were fooled by the labor statistics no matter how wildly positive they seemed to get.
As the BLS took to calculating “the best jobs market in decades” with mainstream extrapolations to nothing but sunshine, credit and funding were singularly unimpressed with real money betting on vastly overstated economic expectations.
The struggle over competing views was settled last year as credit and funding (the “rising dollar”) were proven correct. There was no completed recovery, instead only great economic risk as the slowdown turned toward and into contraction. This sudden interest in the yield curve misses the point, focusing on unsuited precision. In other words, having showed that past bearishness was correct in being bearish, those late to the process now want to use the yield curve as a hard signal for recession as if that cyclical declaration was all that matters(ed).
In past cycles an inverted curve has appeared months before the onset of recession, so the fact that there is still positive spread in the calendar maturities is being taken as if credit is suggesting still some hope for avoiding it. That doesn’t account for the dramatic and systematic change in the UST curve itself due to FOMC policy intrusions and really the eurodollar system’s rise (and the interplay between those factors). I’m not at all convinced that the yield curve will ever invert recession or not; and I will also argue that it likely won’t matter one way or the other. What is important and significant is what has already been observed here.
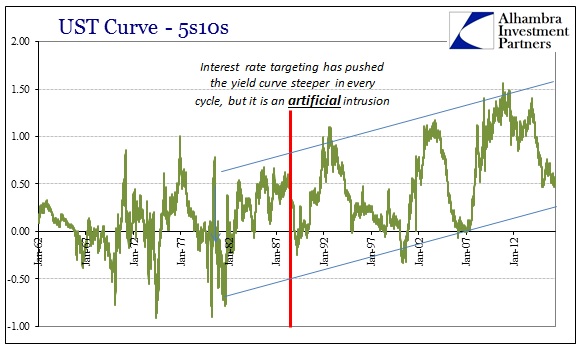
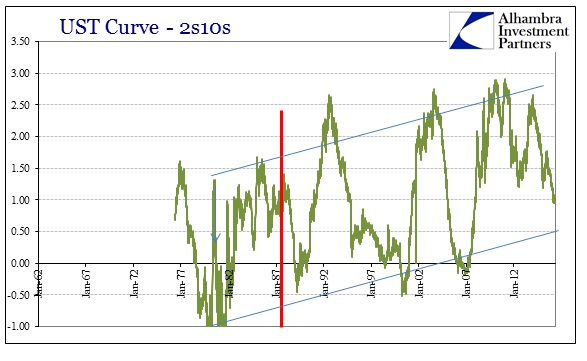
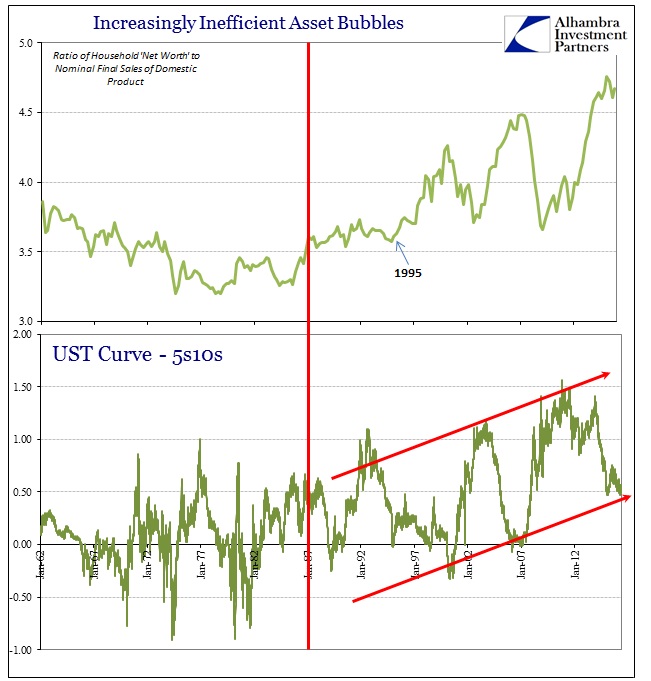
The incidence of the steeper yield curve is itself a reflection of monetary degradation. The FOMC targeted lower and lower rates for the front end which UST bill rates “obliged.” The back end of the curve was relatively apathetic, which had the effect of steepening the curve far beyond the historical range. While a steeper curve is supposed to reflect better long run economic prospects, that was never the case. Instead, that numerically sharper curve only suggested the increasing inefficiency of monetary policy and the direct effects of the eurodollar expansion.
Like the level of inert bank reserves, that part of the “cycle” was only reflective of monetary policy and money conditions rather than actual economic expectations. It was a measure of economic inauthenticity, a factor all-too-easily observed as the artificial yield curve grew only steeper while the real economy grew slower and weaker (impoverished).
So the narrow focus on the +95 bps spread remaining in the 2s10s part of the curve misses the economic slowing and drastic risks that the prior 150 bps of already completed flattening has been proved right about. It is not the absolute level of the curve that has been useful in determining the slowdown condition (or the appearance of slowdown itself) but rather the relative changes and flattening all throughout this “cycle.” That may be related to the artificial steepening from the last two decades or it might be due to the unique circumstances of this shrunken economy (or both).
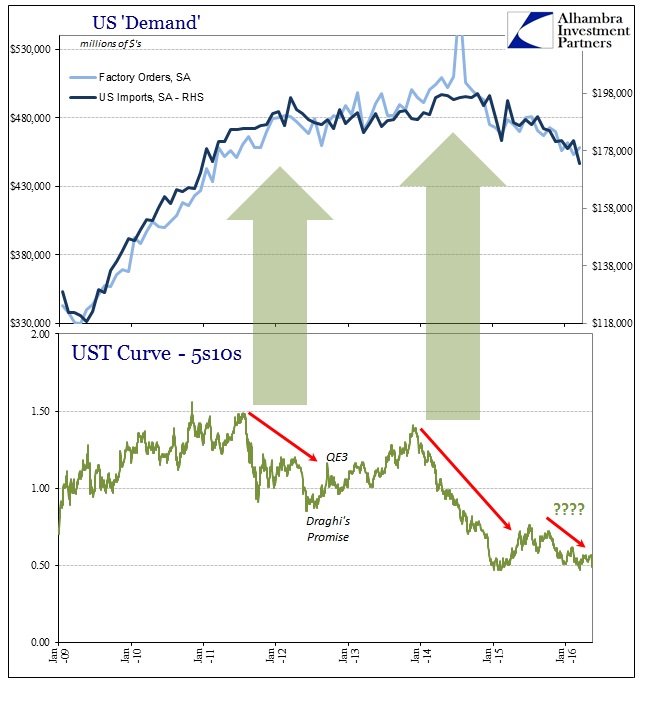
In any case, the yield curve sniffed out both the inflection in 2011 that led to the initial slowdown period as well as the further inflection into the current state of contraction (“rising dollar”). It seems as if the temporary steepening after especially Draghi’s July 2012 promise as well as deference to QE in the US was the last time monetary policy would be given such esteem and faith. That means the yield curve for the past five years had already provided a reliable barometer of future economic conditions but only where significant flattening had occurred. Thus, to ignore this bearishness solely because there was no mathematical inversion was a mistake of pseudo-precision. It may not have been full recession yet to this point, but it really isn’t that far away in far too many economic segments already.
It is entirely possible that the yield curve will at some point in the coming months invert, even where the 2-year note, for example, is trading at 79 bps equivalent yield. Is the 10-year bond going to drop another 100 bps to join Europe and Japan in insanity? It may not matter one way or the other since at this level of the flattened curve the economy has already grown worse with no further move toward inversion necessary. For over a year, bearishness has remained more or less steady here and the global economy slid downward the whole time, settling the “debate” between economists and the markets (as if there was ever any realistic doubt which side would win that argument). The textbook curve deadening could still happen and it is actually realistic to think it might, but you won’t need a negative calendar spread to tell you about the economic circumstances of that further flattening.
Stay In Touch