
In August 2013, the Treasury Department through its Treasury International Capital data (TIC) put a scale on that summer’s disruption. With a two month delay, the TIC figures gave us some insight as to why the fixed income/MBS selloff that summer was so violent; and further why it had so easily spread to currency markets. The destabilization of that event was much more than just certain markets preparing for life without QE, it was, as revealed by TIC, a very deep and dramatic “dollar” fissure.
It was a warning, or, as I called it at the time, a “massive dollar warning.” The alarm itself wasn’t that it had happened but that it signaled a much more intractable global funding imbalance that wasn’t likely to just go away on its own, yielding quietly to Ben Bernanke’s Hollywood ending.
Dollar funding problems are obvious and evident in the net selling of dollar assets. The global banking system is in a synthetic dollar short position, rebuilt after the panic in 2008 thanks to central bank attempts at removing “tail risks” (or at least artificially suppressing market expectations for tail risks).
Long-dated dollar assets are “funded” by short dollar liabilities, largely in eurodollars augmented by currency swaps and derivatives positions. Stress in dollar funding, including volatility in funding expectations, feeds outward into margin calls, collateral adjustments and in general rising liquidity costs.
This is a tremendous warning that all is not well in the global banking system. The synthetic dollar short that plagued the global asset markets starting in August 2007, creating the conditions for panic, has re-emerged in a state of stress once again. Just as the US economy, contrary to what the Establishment Survey projects through its statistical processes, is losing momentum, there is now very little room for changes in policy.
Over the next ten months, it seemed as if this was all actually a one-time aberration. Monetary disruptions come in waves rather than all-at-once, including the great crashes that remain historically relevant. Because of that, each one is forgotten almost as soon as it is declared over. It is only the fuzziness of memory that combines these waves into singular events. Orthodox tendencies have made this worse, starting with an improper understanding of what QE (or money) actually is.
Other than the overdone drama about the debt ceiling/government shutdown in October 2013, there wasn’t really anything that forced the mainstream to confront these serious deficiencies. Eurodollar markets and even the US treasury market had turned bearish around the time of the debt discussions, which I has no doubt were fully related to the disruption that summer. These are not, however, the kinds of signals that get any notice because the mainstream is still convinced “bank reserves” are the sole measure of global liquidity. What is increasingly proven is just how wrong that view can be, especially since all these events correspond to what we see in repo, currencies, and derivatives rather than QE’s inert byproducts.
Not surprisingly, then, QE did not lead to recovery just the expectation for it. The global financial system has only escalated from that time forward as these eurodollar internals churn further and further negative. While the mainstream was surprised to find the “dollar” suddenly “rising” in July 2014, in the weeks before that the repo market had issued yet another “dollar” warning. Fails surged out of nowhere and with no visible explanation (except European NIRP, which is entirely connected to US$ repo; wholesale is wholesale, especially since these are all the same banks); repo rates began to rise along with LIBOR (later in 2014) that was for a time welcomed by the mainstream as evidence the Fed’s happy scenario was coming true. Calibration matters.
Instead, starting October 15, 2014, it has been one disruption after another, with each seemingly adding another major central bank to the “dollar’s” list of casualties. By the time of August 24, the liquidation of that day wasn’t “out of nowhere”, it was simply the next logical progression as eurodollar illiquidity eroded finally out into the wide open of global risk markets.
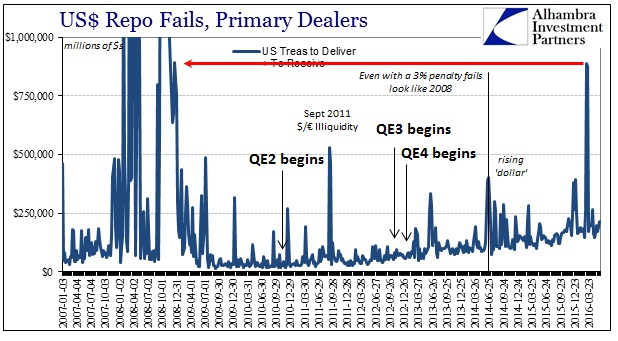
The fact that the epicenter of the “dollar” run was China or at least Asia (Hong Kong and Tokyo money centers providing “dollars” to China) also wasn’t surprising given the character change in the eurodollar system since August 2007. European banks have been getting out, Asian banks to some degree taking their place or at least not retreating as quickly. Internally, there wasn’t any difference at all as you can plainly observe on the charts above. The left side of each is European-centric; the right Asian. To the repo market, it doesn’t matter, as disorder is disorder no matter where it originates and propagates.
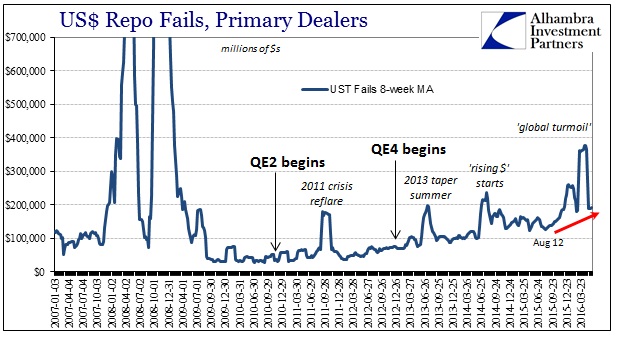
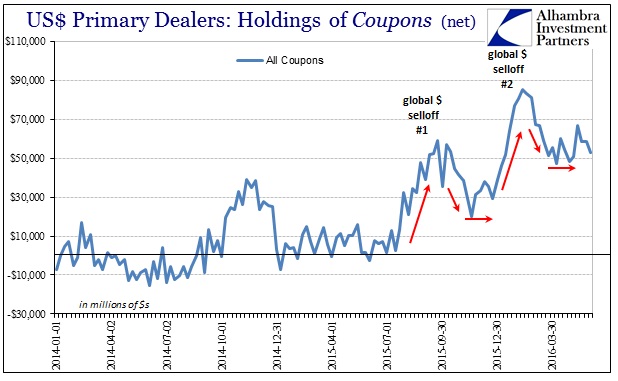
Repo fails have surged since the events of last August, as has the continued incidence of primary dealer “hoarding” of collateral. In terms of net holdings of UST coupons, dealers continue to report highly positive (“long”) positions which mean a lack of securities lending and the free flow of collateral.
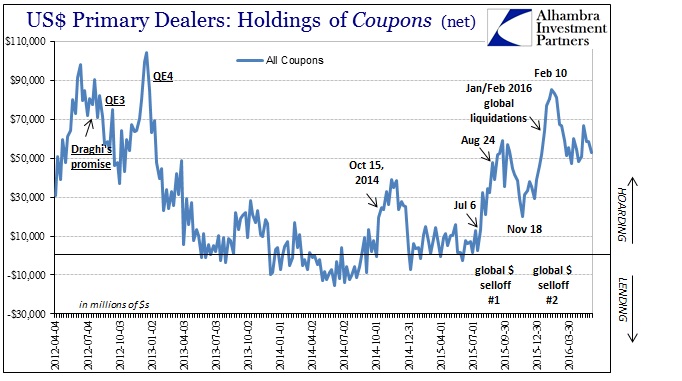
As with repo fails, since these are related processes, we find only intensification or ratcheting of pressure. Even after February 11, there has been no meaningful retracement or de-escalation of these eurodollar internal conditions. In fact, the position of net dealer holdings is yet another repeating pattern, suggesting that liquidity remains severely restrictive after each liquidation episode. In other words, these are not discrete, separate (random to the orthodox perspective) events at all, but a linked, continuous baseline broken only at the surface.
From the GC repo rate we see why these appear to be separate. In very close relation to CNY, the repo rate is seemingly influenced by the PBOC’s derivative “dollar” injections. Internally, however, nothing changes, which is why when those wholesale interventions mature and expire (the “ticking clock”) it can only lead to further escalation. The Chinese central bank (or any other intervening central bank) does not “fix” the “dollar” problem, it can only treat some symptoms of it.
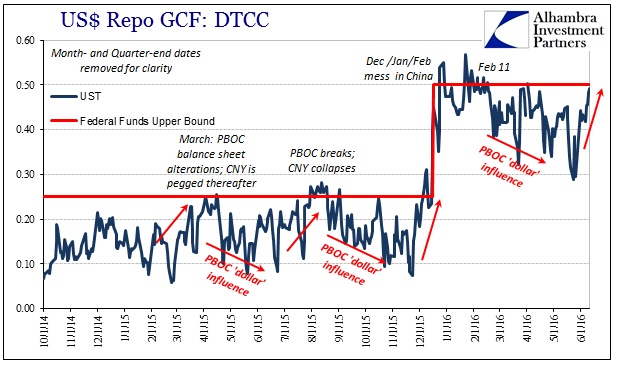
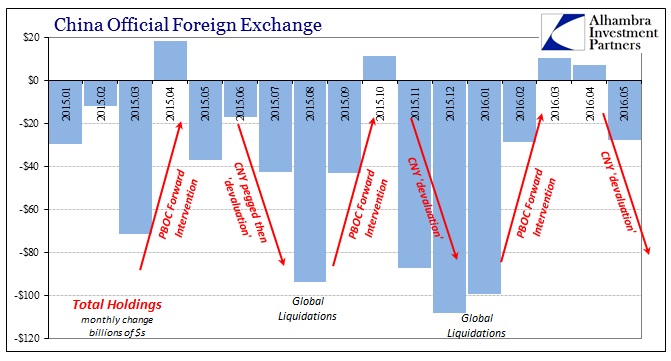
Thus, the GC repo rate (either UST or MBS) starts to move in roughly the same outline as China’s also intermittent “selling of UST’s.” What that suggests is the nightmare scenario I wrote about last September; that expiring wholesale PBOC intervention “crowds out” Asian “dollar” funding so that it spills over in US$ repo (and elsewhere) in these waves that end up like a tightening noose.
As of today’s close, the MBS repo rate (index) was calculated above 50 bps for the first time since April 1, and in non-quarter end for the first time since February 17. That was shortly after the PBOC intervened heavily to push CNY up significantly from its most recent “devaluation” lows. The UST GC repo rate was just shy of 50 bps, also reflecting the irrelevance of Federal Reserve monetary policy that is supposed to supply a hard ceiling of 50 bps to all money market rates.
Practical monetary policy thus seems to have been written in Chinese, but as shown above that is somewhat of a misleading assertion. Monetary policy is the eurodollar system as it operates in an escalating trend and baseline of further disorder and illiquidity. The Chinese “answer” to it has given the PBOC the “feel” of breaking up the dysfunction, but again only in outward and discontinuous appearance.
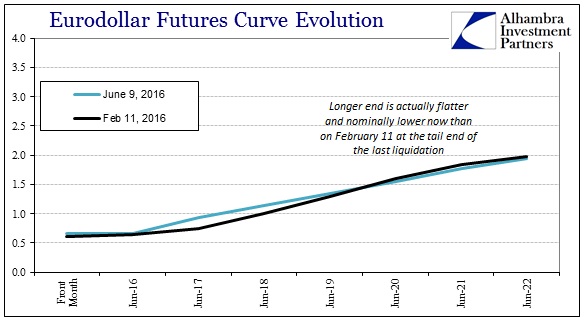
As noted yesterday, there are a growing list of indications now suggesting the general contours of the “next one”, which, properly categorized in this context, is really just the resuming continuation of the “dollar warning” first issued back in the middle of 2013. As eurodollar futures, US$ repo and collateral suggests the last PBOC attempt at writing global monetary policy is once more losing its potency. Economists and the media will be surprised, but there is three years of good data available to anyone who doesn’t think the financial world begins and ends with bank reserves.
Stay In Touch