
As it currently stands in the headline BLS figures, the Establishment Survey greatly rebounded to + 287k from a downward revised +11k in May. There is this month, just as last month, too much emphasis on the monthly payroll figure as it is more often than not noise. We can only hope the drastic extremes of the past two months may have finally injected a more cautious approach to what has always been a statistical process.
Two payroll reports ago, one that was taken as “ugly”, I wrote:
There is very little value to begin with in trying to parse monthly variation, reflected in a wide confidence interval at just 90% confidence. For all we know the jobs market in April 2016 was exactly the same growth as March 2016 when everyone was far more pleased. What we really don’t know is whether both March and April should have everyone elated or seriously worried (obviously, the rest of the economic data points uniformly point to the latter).
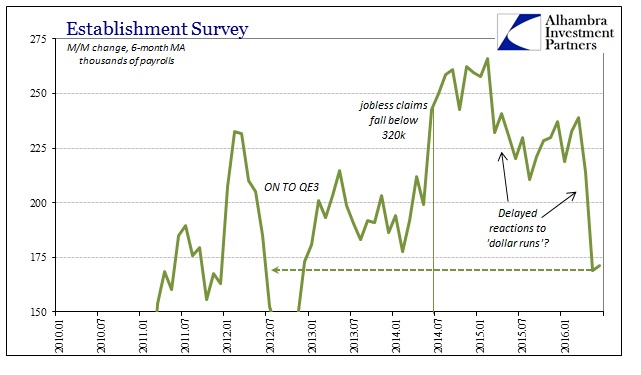
That seems to be the overall message even for a blowout topline figure like +287k; it might be good but in reality there is just as good a chance payrolls in June were no different than May as both may have been somewhere in the middle. Even with that huge gain, the overall trend is still slowing. The 6-month average in June was just +172k, barely changed from +169k in May because the +287k for June replaced +271k from December as it dropped from the 6-month period. That isn’t just significant for the arithmetic of moving averages, it is significant in terms of orientation and determining significance.
In other words, the BLS estimates now that payroll gains in December 2015 ended a 3-month run where the increase in each was above +270k. For three months straight to end last year, the Establishment Survey suggests even more robust conditions than just the one month in June 2016 – and that all amounted to nothing. In the context of the wider economy, the major payroll reports seem to be generating much more noise than meaningful signal.
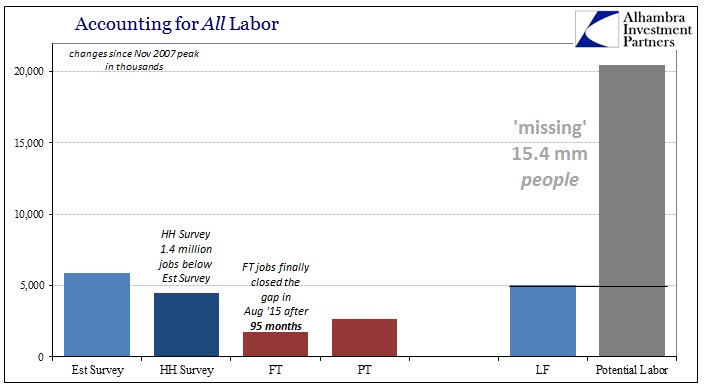
The Household Survey this month adds weight to the charge. Month-over-month, total calculated employees were just 67k more in June than May, remaining then 223k less than back in March. Even though the HH Survey barely changed, the internals suggested that marginal jobs turned into full employment from part time: FT jobs increased by 451k to offset a 491k drop in PT employees. It’s a lot of noise and has been that way for years now, which is why I continue to hold the payroll reports as mostly irrelevant.
What is useful continues to be only the long-term comparisons, especially those of the labor force. There are some misconceptions about the labor force as it relates to the (typical) business cycle, including that Americans will enter and exit in large numbers at the extremes of any cycle. That is simply not true; the labor force through recessions and into recoveries is remarkably stable, a fact which suggests that labor force participation is very much akin to economic potential rather than cyclicality.
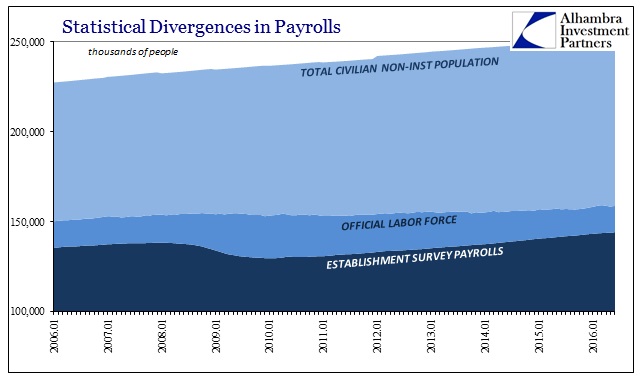
This was true of the Great Recession where the changes in payrolls (Est. Survey) or estimated number of employees (HH Survey) were the primary moving variables. Population growth is largely constant with minor annual variation, leaving the Establishment Survey, as the proxy for the level of employment, to swing with cyclical circumstances. We observe the same pattern in each prior business cycle (I’ll only show two here: 1990-91 and the early 1980’s double dip).
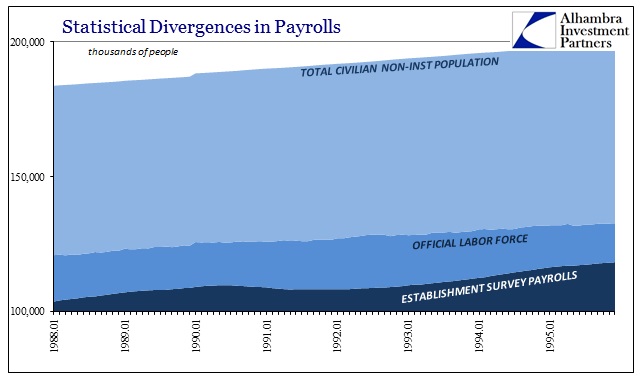
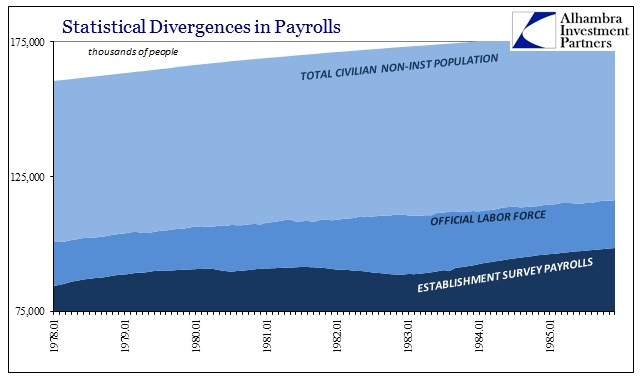
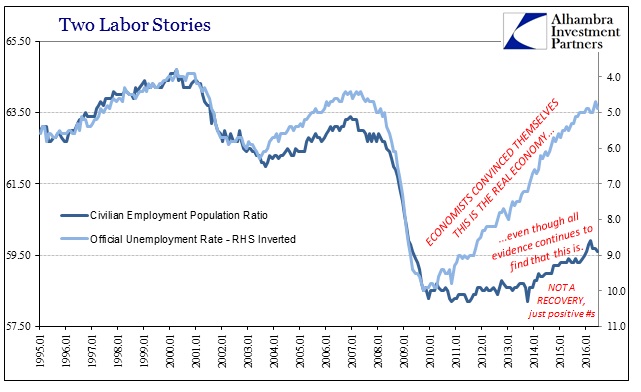
That means the large changes in the unemployment rate in each cycle are primarily determined by the numerator relating to the cycle in employment. “Full employment” is thus defined where the level of employment relates to potential, in this case the near-constant labor force responding to non-cyclical factors and perceived conditions. From that view, we already know that the Great Recession has been very different as exposed by the participation problem. In fact, it has deviated on at least two counts that are, I believe, significant in determining the overall economic context far more relevant than +11k last month and +287k this one.
First, the labor force in contrast to prior cycles actually shrunk. It wasn’t a huge contraction, but certainly noticeable in comparison.
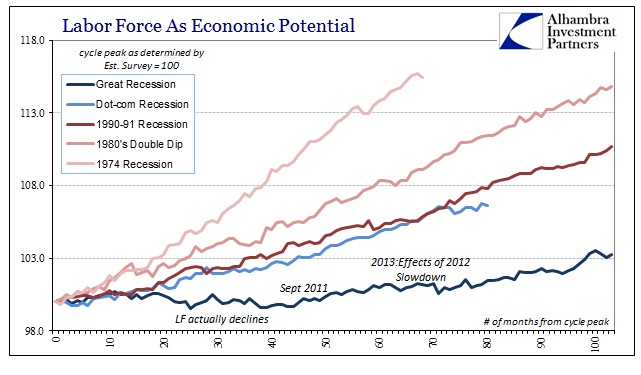
That speaks to the severity of the Great Recession, both in terms of time and depth. The worst parts of it didn’t take place until about a year after the prior cycle peak, with the greatest negative pressures and intensity occurring in early to mid-2009 – almost a year and a half after entering the “cycle.” The Labor Force begins to falloff most right at that point, suggesting that the severity of it in contrast to prior cycles did indeed alter the labor mechanics which, in this case or perspective, represents potential.
It took some time thereafter, but the labor force did start to rebound around month 40 (March 2011). Unfortunately, while that may have indicated something like a forming recovery in potential it came about at the worst possible time – almost as if perfectly timed to greet the looming 2011 re-crisis. By the start of 2013, following the obvious reduction in economic activity in 2012 all around the world, the US labor force was slightly declining yet again. Though it has rebounded in the years since, it does so in the same “smaller and slower” pattern that we find in so many other economic accounts.
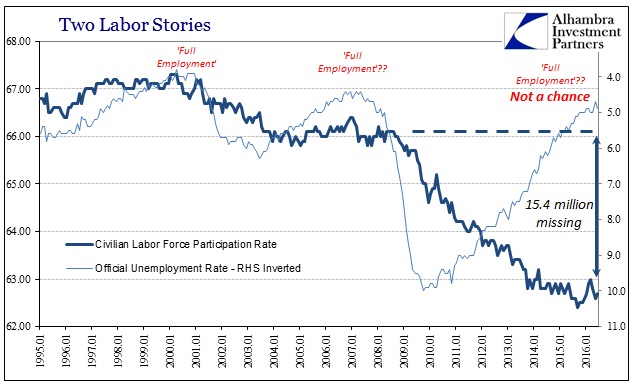
It suggests in more chronological detail exactly what we find in the participation problem. The economy shrunk, meaning potential, which makes “full employment” in 2016 applicable only to a far smaller proportion. By viewing the labor force as a proxy for potential, we see the effects of both the Great Recession’s unusual depth as well as the devastating relapse in 2011 – all distinct from behavior in prior cycles including the dot-com recession. Those inflections are both monetary affairs, meaning that the wider context of labor statistics would seem to agree with monetary strangulation as a matter way beyond cyclicality.
Stock markets are up on payroll enthusiasm, but broader credit and funding markets aren’t buying it. UST’s are slightly higher (price) while gold is holding steady and eurodollar futures have sold in the front month appreciably more than the contracts immediately behind it (Fed might raise rates and, as usual, make a bad situation worse). When the December payroll report was released in early January, the 10-year UST was trading around 2.15% in CMT yield, having been stuck around and near 2.25% through that 3-month run of purportedly good labor fortune. The yield half a year later is less than 1.40%. Either the official labor market story about the end of 2015 was just noise, or the bond (and funding) market no longer cares much about payroll statistics good and bad.
Stay In Touch