
On June 3, the May payroll report was released shocking convention by its “unexpected” weakness. It was, and so far remains, the worst headline number since 2009. Because the suggestion of a far weaker labor market than policymakers have been claiming undermined their whole economic narrative, “markets” immediately reversed course and bid as if there would be no rate hikes (RHINO and all) the rest of the year.
In more appropriate wholesale terms, it unleashed a mini-flood of “dollars” as those who had them (claimed to) began “selling” them into a funding market starved of them. It offered particularly the Chinese a welcome reprieve, if only temporarily. In the mainstream, this did not go unnoticed if still contextualized via traditional understanding. By June 8, oil prices hit their high as Reuters at the time noted:
Commodities rallied on the weaker dollar, and crude oil futures hit fresh 2016 highs on persistent worries related to supply outages.
The dollar hit a five-week low against a basket of currencies as traders reduced bets of an imminent U.S. rate increase following a weak jobs report and perceived dovish comments from the Federal Reserve Chair Janet Yellen…
“As we saw with the clearly disappointing jobs report, even some bad news is not enough to shake off the positive feeling that has been driving prices higher,” he [Bruce McCain, chief investment strategist at Key Private Bank in Cleveland] said.
I don’t follow the dollar indices as a practice because by and large they include other wholesale reserve currencies (yen and euro) which can lead to confusion about the direction and condition of the eurodollar against the rest of the world. The heavy proportionality of Europe and Japan can suggest periods where the index is falling but the “rising dollar” still remains in effect, a seemingly contradictory outcome. In this case, however, there was something to it even if it escapes the grasp of commentary. We can actually observe it quite easily in the WTI curve. Though the quoted expert refers to “positive feeling” as a condition, in reality it was an increasingly better “dollar” environment; or “weaker dollar” as it may be called.
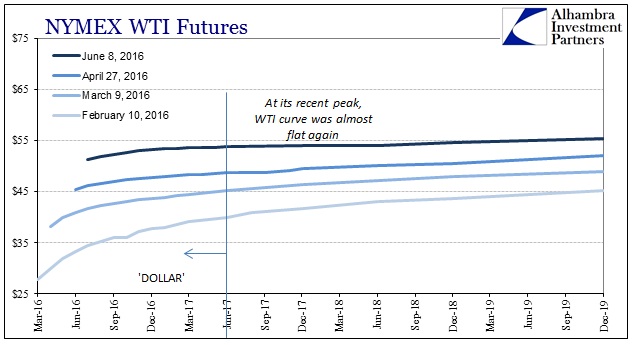
From the liquidation low on February 11, the entire WTI curve has shifted upward but far more so at the front end that is set by financing conditions. By June 8, the WTI curve very nearly flattened out in its entire length, front to back. Crude oil is supposed to trade in backwardation, so that it would “try” to get back to the condition is natural. It has been the funding intrusion of these “dollar runs” that distorted the curve into episodes of dramatic contango on the left side (while pushing or pulling the whole curve in between).
The level of contango has played a prominent role in determining domestic crude inventories. As “dollar” illiquidity grew, primarily in relation to Chinese connections to the eurodollar, and the WTI curve steepened at the front in heavier and heavier contango, domestic inventories surged. We see the two “dollar” waves (first in late 2014 and early 2015; second July 2015 through February 2016) in the crude stock estimates from the US EIA.
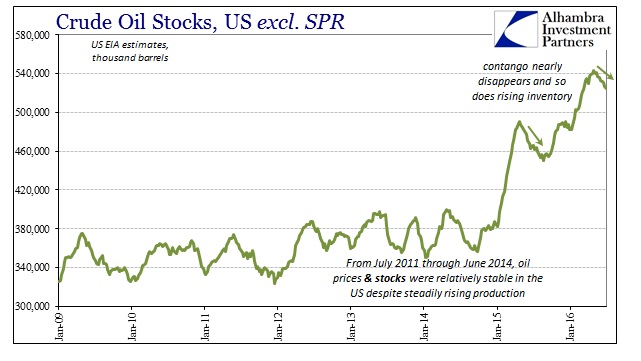
Domestic inventory peaked the week of April 29 (lags to the futures curve in physically locating and moving oil) and has been falling pretty steadily ever since. At the same time, production levels have, too.
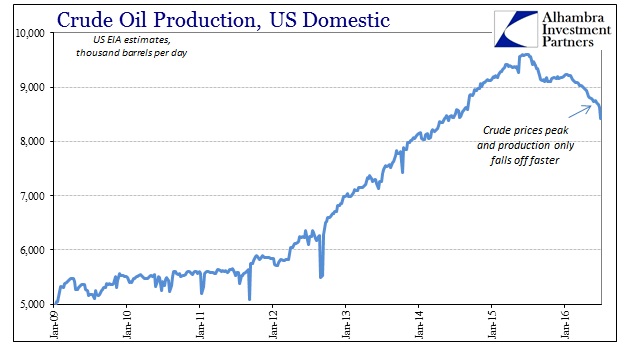
Combined with the decline in “dollar” funding pressure, particularly as the Chinese began accepting oil from client states in OPEC and Africa for loan repayments, breaking, somewhat, the Chinese “dollar” connection to oil prices, these were all fundamentally positive support for rising WTI and global crude.
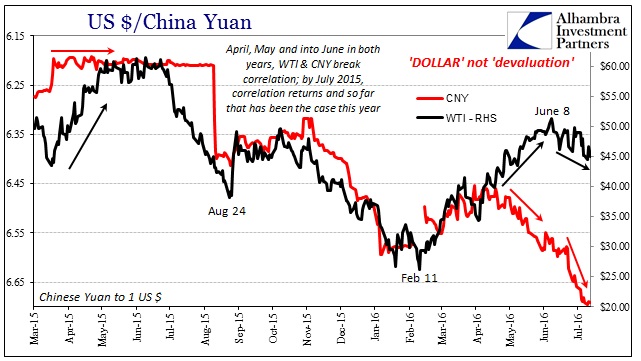
However, even though fundamentals continue to be outwardly price positive, WTI has been falling since June 8. “Positive feeling” about the economy or risk appetites has been superseded again by the “dollar” now in the “wrong” direction again regardless of how that works out in any currency index. Just as we can see the receding “dollar” pressure in the WTI curve from February 11 to June 8, we also can clearly see that it has started to intrude all over again (the front hasn’t yet pulled the whole curve lower).
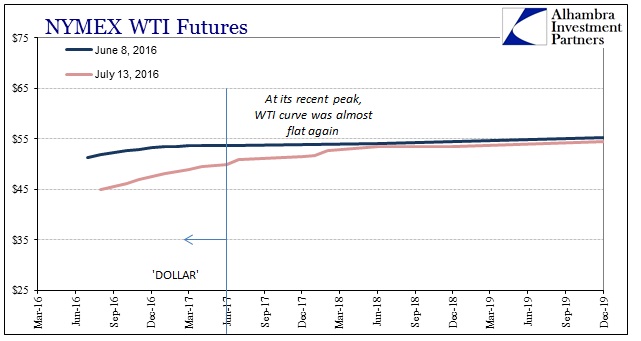
WTI futures prices in later 2017 and beyond have barely budged from the June 8 (front end) highs; all the action is at the front again in steepening short-term contango. The exact reason for the inflection specifically after June 8 is unclear, though there are several suspicions that all point in the “dollar’s” direction (and include the Chinese in the mix; imported too much oil too fast?). Whatever was and is the cause, it is entirely reasonable to assume that the “dollar” is back again and so far right on schedule.
Stay In Touch