
Everyone knows about lies, damned lies, and statistics. The quote has been attached to Mark Twain who apparently attributed to British Prime Minister Benjamin Disraeli. It remains among popular clichés because there is universal truth to it, a sort of caveat emptor lying in the background whenever one consumes an argument. Nowhere is that more the truth than economics and finance, disciplines almost (nowadays) entirely populated with statistics and very little else.
Given the rather extreme nature of the times, extreme statistics are more prevalent perhaps than at any other point. They run the spectrum, as do human intentions, from the purely mistake to the malicious. The better stats, as the best lies, are often difficult to discern because they contain a great deal of truth; requiring a great deal of further analysis and scrutiny to unpack the error or mistake. Sometimes, however, it takes very little effort (reflecting both on the numbers and the person wielding them).
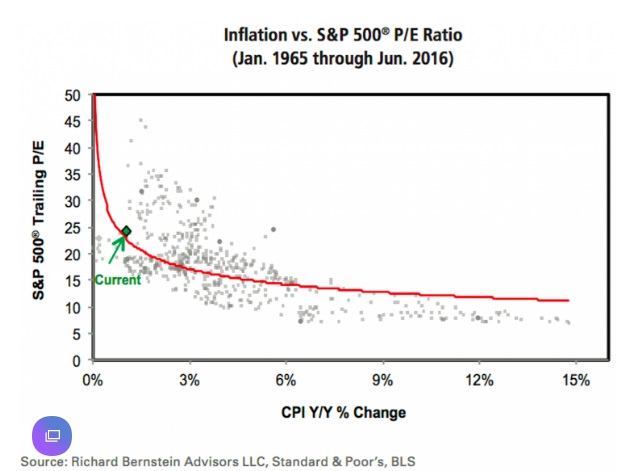
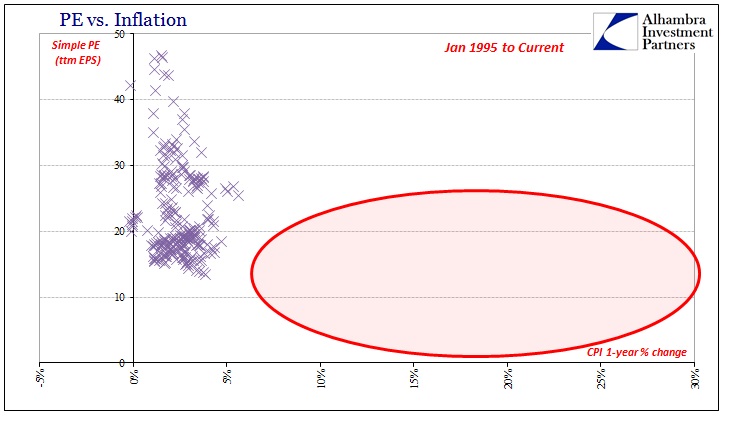
Prominently displayed on the front page of Yahoo!Finance today was an article whose purpose was just so barely disguised. You can and should read the whole piece, but the gist is essentially that we shouldn’t worry about very high valuations to the current stock market because valuations aren’t so simple. The expert quoted in the article declares that PE’s at this point, well above 20x, “do not contradict the bullish case for stocks.” The reason is low inflation and related low interest rates; an argument proposed and reiterated many, many times before.
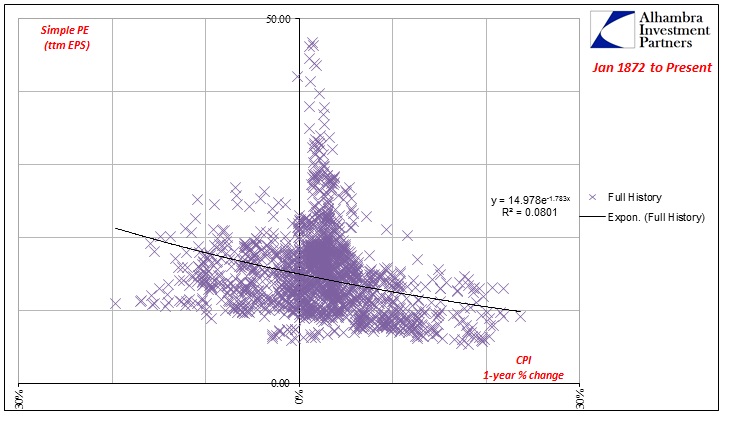
There are statistics for this view, including a neat chart showing the relationship between PE’s for the S&P 500 and their coincident inflationary circumstances (represented by the 1-year change in the CPI).
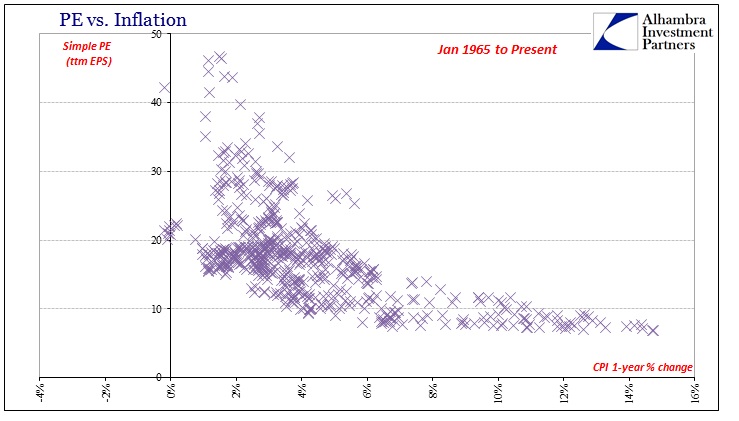
Using Robert Shiller’s data for the historical S&P 500, inflation, and earnings, I recreated the same chart with very nearly the same results.
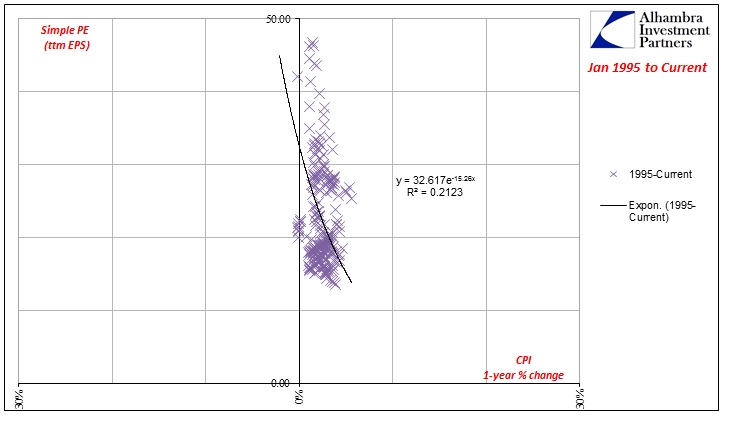
Running a simple, exponential regression (a polynomial regression finds a better fit, but raises the objection of being fitted), you do find a relationship that argues in favor of the proposition; inflation and PE’s are to some degree negatively correlated.
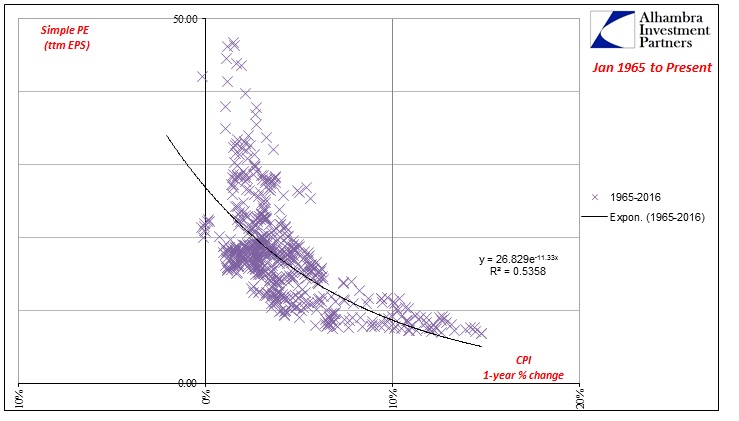
Because I found the same as projected in the article, I can confidently declare it nonsense. I did not test for statistical significance in the regression because it simply wasn’t necessary; this argument falls apart long before the math.
This is simply a case of, at best, circular logic or, at worst, intentional obfuscation. The first clue is the time frame itself, starting right on the cusp of the Great Inflation. Given the much further history of Shiller’s data, we need not be so discerning. Going back further to the 1870’s provides a much different result.
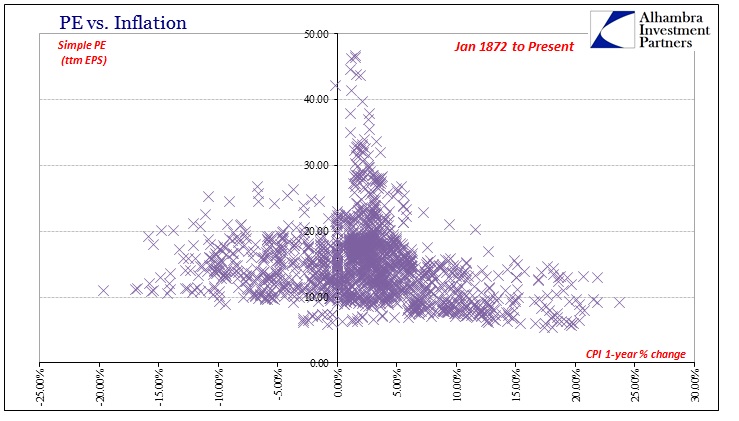
The regression using this full dataset is far, far less compelling. You don’t even need the regression to see the distribution – the densest area of the scatterplot above is between 0% and 5% inflation and 10 and 20 times earnings.
There is still, however, some mathematical relationship even though the R-squared is especially low. If we perform our own transformations in framing the time period, this apparently inverse correlation is revealed more clearly. If we instead end with only through the last part of the Great Inflation, to December 1979, we actually find very little to support the hypothesis.
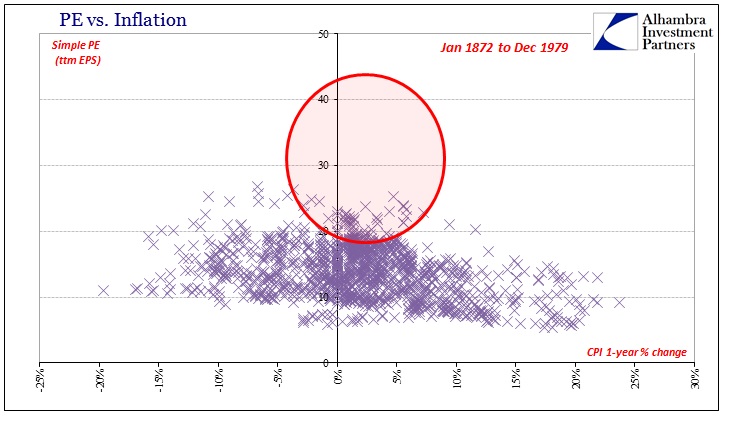
There is actually very little reasonable correlation between inflation and PE’s to this point in history; a slightly detectible hint but without a whole lot of variation. Notably absent are those more extreme, higher valuations that perform the upward transformation in the original regression. Moving forward in time to December 1994, we find some indication of a greater cluster starting to move up the axis (the Great “Moderation”), but still nothing like the original premise.
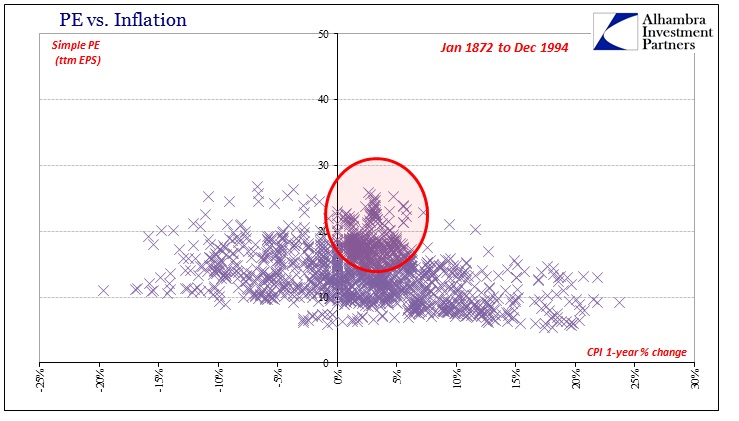
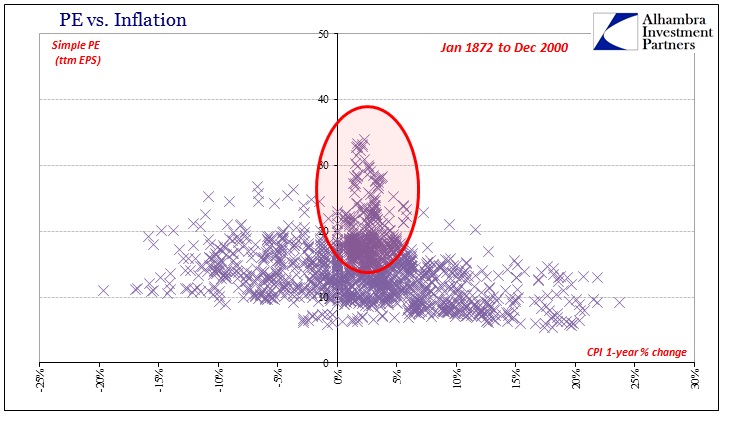
It isn’t until we add the latter half of the 1990’s and the dot-com bubble that these “positive” valuation outliers suddenly appear (the rest of them don’t show up until, ironically, the Great Recession when earnings fell very far in coincidence to disinflation and even negative inflation). This is, of course, wholly unsurprising.
But there is more to the deception, which is why the Great Inflation period was included. If we isolate just age of asset bubbles, the relationship once more disappears almost entirely.
A regression function that plots almost vertically means that PE valuations have moved around almost totally independent of the CPI. In other words, without including the Great Inflation period and its immediate aftermath to fill in the bottom right there is again no mathematical significance between inflation and PE’s. In isolation, the market valuation since 1995 just doesn’t bear any resemblance to inflation, leaving it as a function of some other independent condition (such as monetary agency). It is only by included the “other” extreme of low valuations and high inflation of the 1960’s and 1970’s that gives this assertion of causation the thin veneer of validity.
But that is hardly the same scheme as what was proposed. What these figures show is really much different; from 1965 forward, the most that can be said is that there were generally lower valuations as high consumer inflation raged before the 1980’s. After 1995, there was generally much higher valuations and lower inflation. It does not follow, then, that valuations are determined by inflation – at all. Causation would appear to be among the “error” terms or more likely independent variables left out entirely, which is what the full data set suggests. There is no data suggesting what valuations would do with very high inflation (recorded in the CPI) after 1995 because it hasn’t happened; likewise with low inflation during especially the 1970’s.
These are cases, then, that must be taken in isolation, not as a universally-applied “rule” or even suggestion. To add one is a blatant misuse of correlation, again an indictment first suggested by starting with and only including the period after January 1965. Including the Great Inflation and its opposite extreme muddies the interpretation because you can’t immediately discern the separate circumstances as separate. To claim that low inflation after 1995 supports high valuations is tantamount to wholly biased selectivity; there is no evidence to prove (or disprove) the assertion, an invalidation in statistics as well as basic logic. All the math shows is that there was low inflation.
That is really what the full data tells us, with one very important contextual addition. Comparing the years without the dot-com bubble and finding very little relationship means that it is only through the high valuations of the dot-com era (and to a lesser extent more recently) that gives this idea its apparent (and still wrong) relevance. That would mean the original premise contained in the article is using the incident high valuations of the dot-com bubble because they occurred during a period of low CPI inflation to propose that high valuations today aren’t threatening because we still find low CPI inflation. It essentially advises that the last big stock bubble justifies why we shouldn’t be worried about another one.
That was Twain’s, as Disraeli’s, point all along. If you have a strong argument you don’t need to resort to bad math to make it; bad math is instead used, often intentionally, to obscure the weakness.
Stay In Touch