
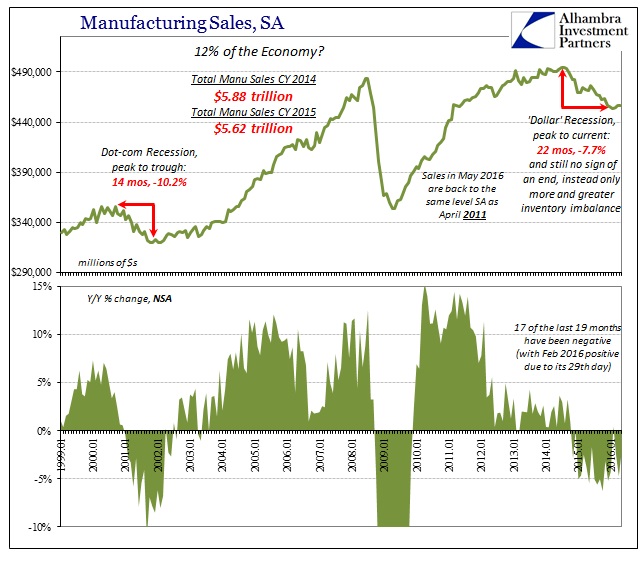
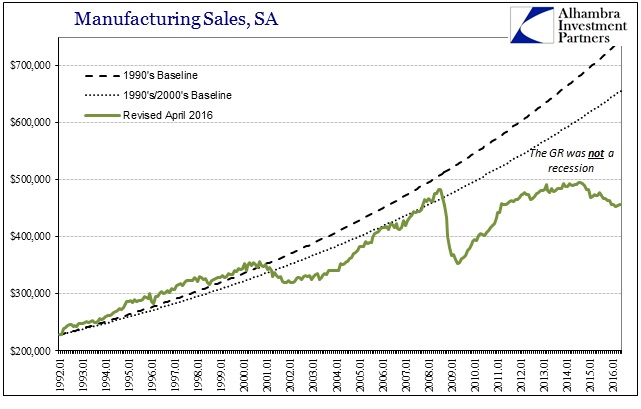
Manufacturing sales were reported Friday to have declined 2.3% year-over-year in May, following a 4.7% contraction in April. Since sales in May 2015 were almost 6% less than May 2014, the manufacturing sector counts almost 8% less in revenue across two years of contraction. The worst part is, again, the time.
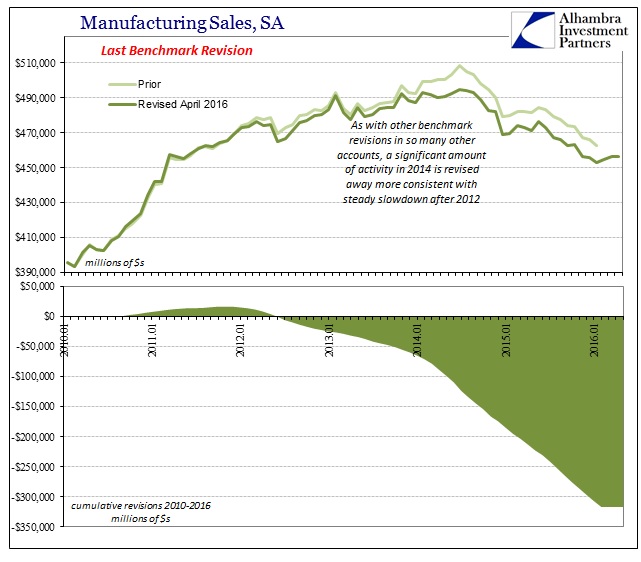
In seasonally-adjusted terms, estimated sales of $456 billion in the latest month are equivalent to April 2011. In short, two years (and counting) of contraction have erased overall five years of stagnation. Following benchmark revisions in April that, as usual, subtracted a significant amount of previously figured activity from 2014 and 2015, we are left with a domestic manufacturing sector in persistent decline that doesn’t alter the supply imbalance nearly enough.
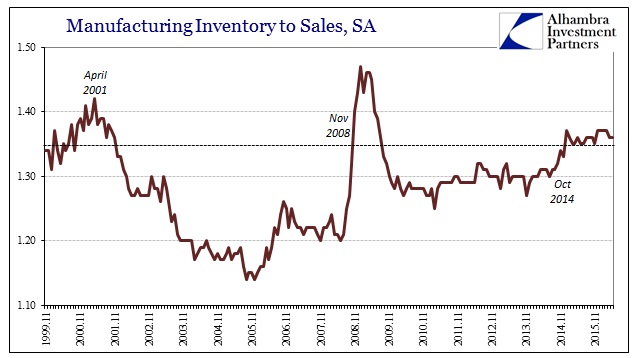
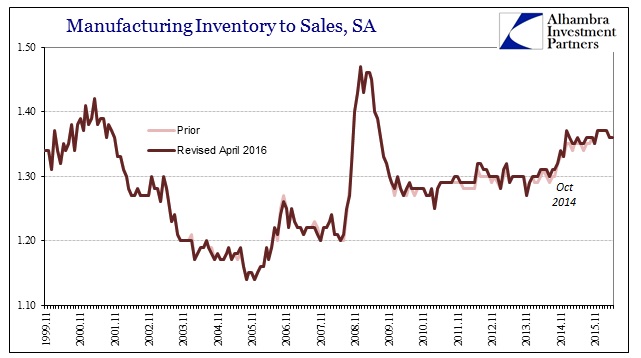
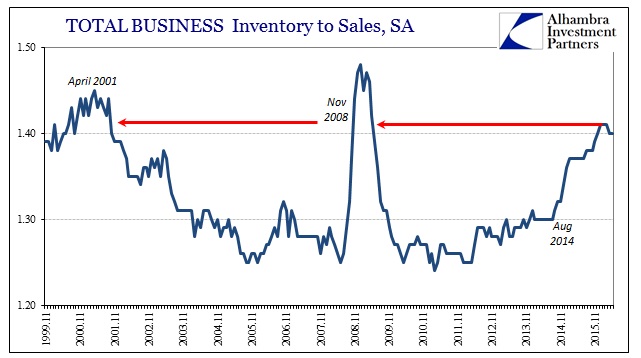
Since jumping to 1.37 in January 2015 from 1.33 the month before, the inventory-to-sales ratio for the manufacturing sector has been stuck above 1.35 the entire 17 months since. During the Great Recession “cycle” in 2008, we didn’t find an equivalent ratio until November 2008. In the early 2000’s and the dot-com cycle, back when inventory at all levels were systemically higher, the ratio didn’t stay above 1.35 until October 2000 just months before the official start of that recession.
What is most important, however, is that once inventory grew so imbalanced in those prior cycles it didn’t remain that way. Overall, the inventory-to-sales ratio was only above 1.35 consecutively for 14 months total through the end of 2001. By December that year, as both production and inventory were falling precipitously, the ratio quickly fell back below that standard so that only four months later it was just 1.28 (and still declining).
Similarly during the Great Recession manufacturing inventory only stayed above 1.35 for 10 months; and even that duration was due to the fact that sales had fallen so sharply that heavy inventory liquidations needed several months to catch up.
That can only leave the manufacturing sector as experiencing something entirely different than the usual business cycle. After 22 months of contraction (SA), where declines are now stacking up one on another, there is somehow no progress in inventory at any part of the supply chain. As I have written elsewhere, I think the reason for it is that nobody really knows what this is; there is truly no prior economic context to apply as a template or guide, leaving economic agents searching for answers and finding only contradictions.
Inventory stacks up rather steadily and sales fall but more so gently, to which the mainstream tells business to hold on because weakness is only temporary and the payroll reports will actually apply to the real economy just around the corner. Since it isn’t recession but slow steady contraction, it seems as if (some) businesses are sticking with that hope no matter how long it drags on. Without a recession to disprove the optimism, we are conditioned to believe in growth, even slow growth, as the minimal setting outside of it.
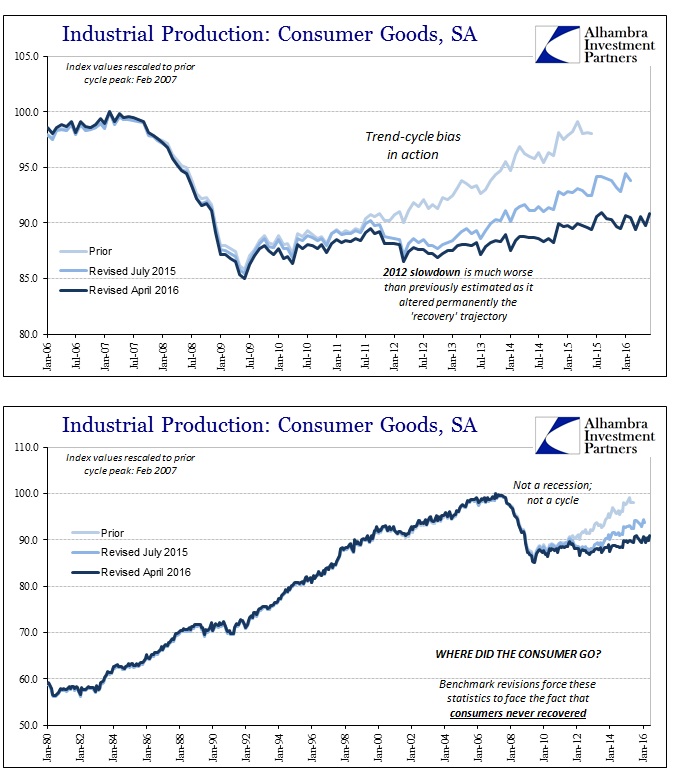
But as the 2014 and 2015 periods get revised, we find out that the BLS figures have only been less relevant this whole time. More than that, as in all parts of the goods economy, really the consumer economy, we see that the past five years or so are unrecognizable compared to what “should” have occurred, meaning that “transitory” can’t possibly apply to almost a decade of falling short.
It may be that because cyclicality no longer applies cyclical “rules” or at least expectations don’t, either. That has certainly been the case both during the slowdown that formed in early 2012 and during the contractionary period of the past almost two years. That doesn’t mean, however, common sense doesn’t apply, which alone suggests that heightened inventory plus steadily contracting activity and sales will only mean that this unprecedented condition will continue – until it finds whatever settled state awaits at the end of it. That still might mean another “recession” like 2008 where the economy shrinks and then further fails to recover, or what one would call depression.
It’s not a stretch to use that term by any means; the chart above shows at least something very much like it and it is not, unfortunately, unique. The Fed continues to try to tell us that the labor market is robust (especially toward the end of 2015) when there just isn’t any trace of it where it really should show up. At least in the middle 2000’s you could offer China as an alternate explanation for unusual weakness in the recovery of domestic production from the dot-com cycle, but China has now joined US manufacturing in wondering what it is Janet Yellen has been talking about for more than two years.
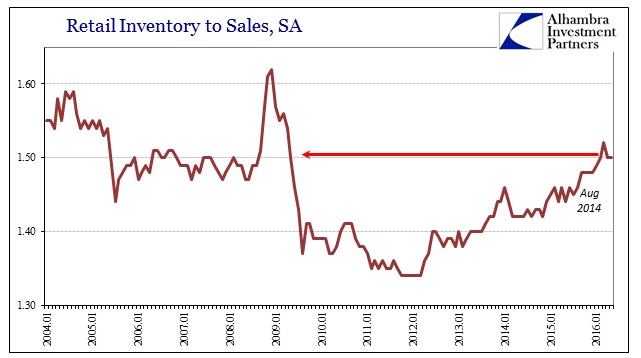
Everything in the “goods economy”, from manufacturing sales to retail inventory, demonstrates consistently economic circumstances that indicate severe and continuing economic malfunction even if it doesn’t conform to usual cyclicality – that means consumers and really income. I think it is huge mistake to believe or suggest that because the economy is not obviously recessionary that there is no danger. Because the incrementalism of first the slowdown and now the contraction escapes the typical cyclical pattern of big moves, it seems even reasonable that manufacturing would fall into recessionary imbalance and then stay that way; certainly more reasonable than continuing to expect “overheating” any day now. Actual growth is the outlier scenario here.
Stay In Touch