
The Chinese have been undergoing quite a bit of stress lately, with markets including stocks more likely to be in turmoil than not. In fixed income, the Finance Ministry was slightly shaken by a failed auction today, its first since summer 2015. Yesterday, government bond futures trading had to be suspended when the 10s and 5s experienced their largest drop (in price) ever.
All of this, of course, is being attributed to Janet Yellen, in particular the perceived “hawkishness” of the dot plots. It is probably more a media creation than anything else, as markets are much less likely to believe there will be three more rate cuts in 2017 after the Fed suggested there would be four in 2016. Regardless, the mainstream struggles to explain that which it clearly doesn’t understand.
The benchmark stock index has tumbled 3.6 percent, poised for its worst week since April. The yuan depreciated to its lowest level against the dollar since June 2008, while government bonds plunged, with the 10-year yield surging by a record 22 basis points on Thursday.
While some of the losses can be attributed to the Federal Reserve’s prediction of three interest-rate hikes next year, China has its own sources of stress. Surging money-market rates sparked by government deleveraging efforts are curbing demand for everything from equities to debt at the same time as capital outflows accelerate.
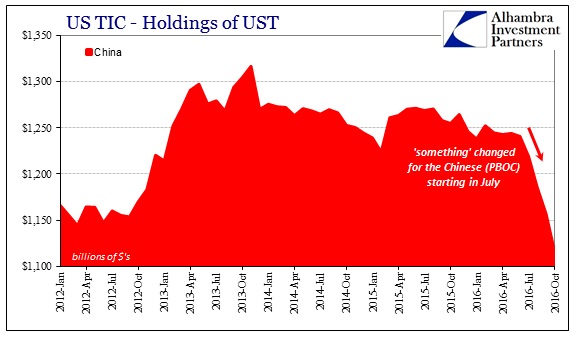
None of this is surprising, nor is it related to the irrelevant federal funds rate. The Chinese have been building toward these outcomes, “dollar” to RMB, for months now, the primary victim of that “something” perfectly visible all the way back to July. This isn’t to say that the rate hike this week has had no effect at all, just not in the way it is being described. At most, the latest selloff in China and elsewhere could have been triggered by perceptions about the FOMC, but the illiquidity which has made it all so noticeable long predates US monetary policy symbolism.
The updated Treasury International Capital (TIC) figures once again make that plain. The next Treasury Secretary should make it his first job to figure out how to get these estimates calculated and disseminated in something like realtime, as what they show is the background “dollar” conditions that help very well to explain that it is “dollar” not Yellen; continued illiquidity and monetary suffocation, not “reflation” and recovery (which the Fed itself has totally redefined to mean something far different than recovery).
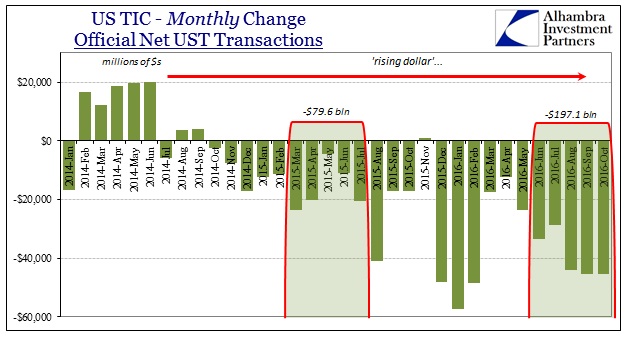
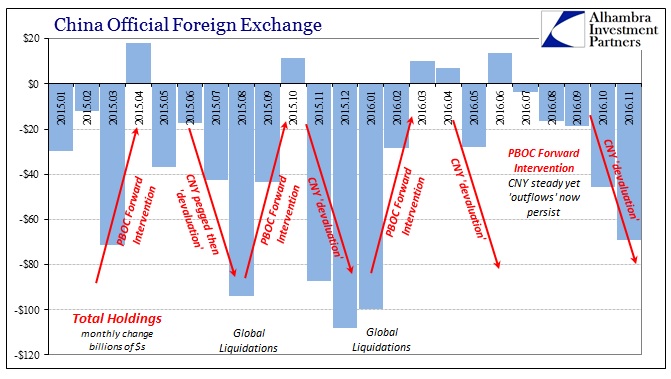
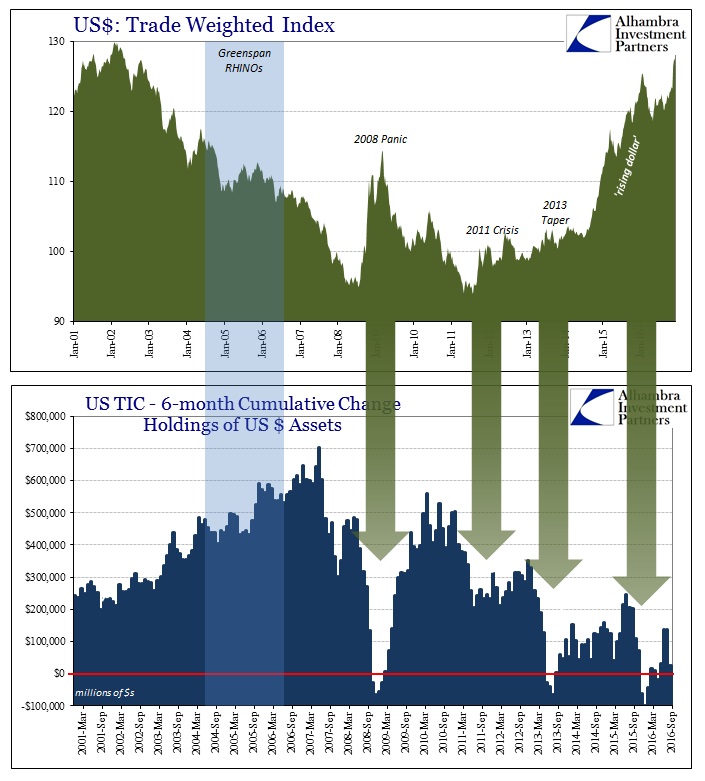
Official “selling” of UST’s according to TIC remained huge in October, the third month in a row of about $45 billion net drawdowns. The past three months have been exceeded only by the three months December to February (very bad months for global markets), and not by all that much (-$134.9 billion August to November 2016; -$153.6 billion December 2015 to February 2016).
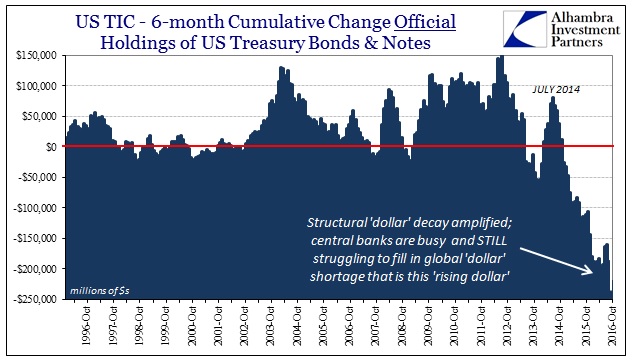
That brings the rolling 6-month total net “selling” to -$220 billion, a new record for central banks and foreign finance ministries trying to fill their “dollar” funding gap. As is absolutely plain on the chart above, this all has had nothing to do with the FOMC’s irrelevant vote and everything to do with “dollar” scarcity. In order to maintain even the semblance of funding stability for the private “dollar” market, the official sector has been forced to extreme levels this year.
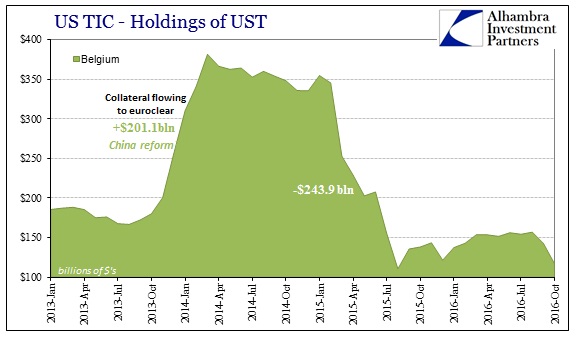
The Chinese have been right at the forefront of this problem. We already have partial confirmation from their side as to falling forex holdings, but TIC shows even larger “outflows” than those reported by SAFE (not that these figures should or will ever agree). If we include the large decline in reported Belgian (Euroclear) holdings of UST’s, the net fall for China would have been $67 billion in October alone.
It is not just China, however, though other localities are not driven to the same degree and extent as the PBOC. In Japan, for example, though the Japanese officially surpassed the Chinese to become the largest external holder of US government securities, their reported holdings have also declined and also dating back to July. The difference for Japan, and I think related to China, is that JPY has followed the TIC figures roughly but to the inverse of how the Chinese experience it. Thus, July’s turning point for JPY (first seemingly pegged at 100 to the dollar, and then back to falling again toward late September) seems to be quite likely related to what the Bank of Japan did with regard to “dollars” rather than yen.
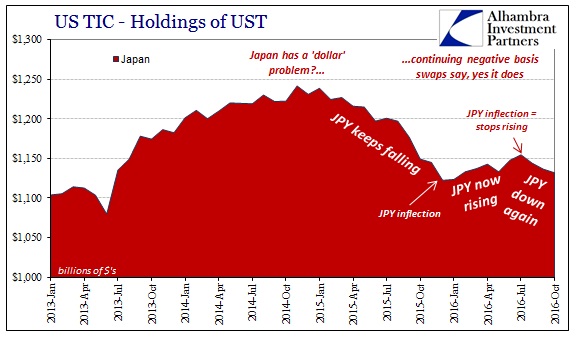
In late July, the Bank of Japan doubled the size of its dollar lending program to $24 billion, a move that was powerfully representational. In addition, they also extended unlimited (in theory) FX swaps for dollars in rolling 1-week tenders. But they also added another conduit to the BoJ’s balance sheet, making available some of its holdings of UST’s to be used in a three-way repo to obtain access to those dollar swaps. That last instrument would propose that BoJ was responding to a collateral shortage as well as dollar shortage, and thus might help explain what you see above (and a good deal more) in Japan’s TIC that also relates to the movements in JPY.
As always, however, throughout the summer these statistics and money market indications were blamed as simple, benign 2a7 reform. I honestly don’t know what has replaced that excuse in the two months already past the reform implementation, likely just these vanilla, unperceptive references to the FOMC, but whatever it might be “dollar” problems remain indicated in all the same places. Selling in asset markets has manifested differently (risk last year, bonds this year), but that is a separate set of circumstances as a consequence of the same “dollar” shortage.
Instead, it has always been balance sheet capacity. We don’t have a great many statistics to give us much insight into global “dollar” capacity in balance sheet terms, but TIC does provide an estimate for what it calls In Banks’ Own Net Dollar-Denominated Liabilities. As the label suggests, it is at best a crude proxy for what we are after, but a very good one nonetheless in terms of providing backward confirmation of all that has happened.
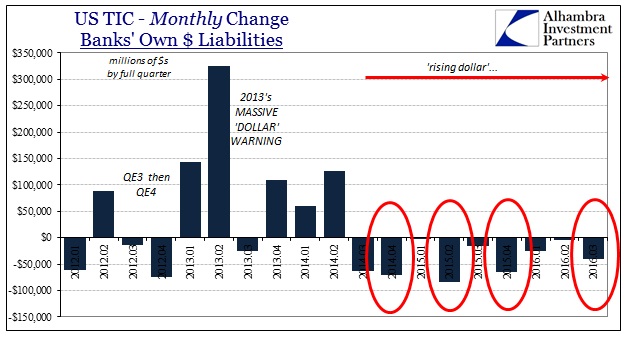
As noted the past few months, there was an unusual lack of take-up in bank liabilities to start Q3 in July. Originally it was reported that July’s positive offset (to the now usual heavy quarter end window dressing) was just +$47.6 billion, far less than the +$188 billion in April that has been more typical. July’s figure was revised first lower and now higher, but even as it stands estimated at +$87 billion, it left the quarter overall as suggesting conditions more like some of the worst of the past few years.
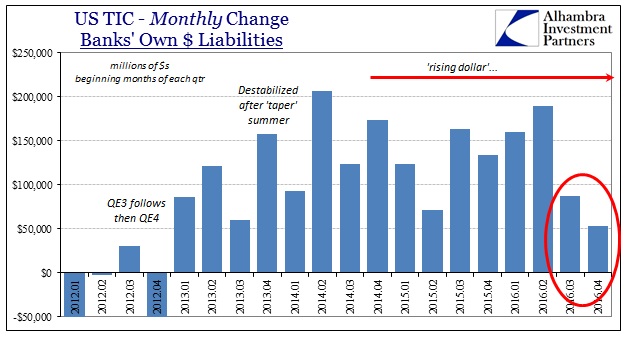
The current update for October indicates, unsurprisingly, another very weak start. At just +$53 billion, that level would seem to confirm “dollar” problems that clearly extended into Q4 originating again where they always do.
The closest comparison is the beginning months of the first and second quarters of 2015, not exactly an enthusiastic endorsement for global funding conditions.
This data does indicate a consistent background for what we find in actual realtime conditions. Among the more important of late has to be the most recent escalation that has now captured Hong Kong money markets, and not just those located in that city funding in offshore RMB. In other words, that this global illiquidity has spread to the Hong Kong dollar is both consistent with the indicated further balance sheet reductions (which is also indicated more indirectly by the huge amount of official UST “selling”) and an important point of emphasis that, again, this has nothing to do with 2a7, the FOMC, or Santa Claus.
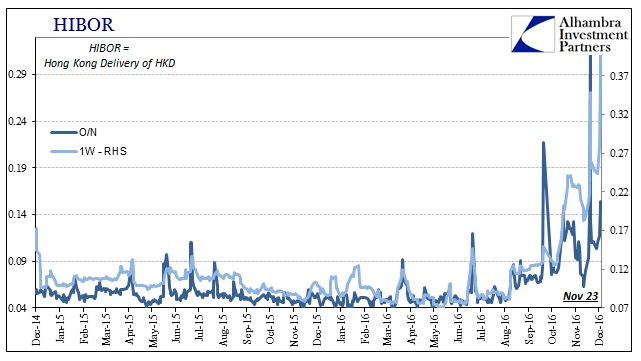
As you can see above, Hong Kong’s liquidity drain began also toward the end of July, manifesting in a noticeable jump in HIBOR rates right in mid-August. Just like all of these TIC figures further suggest, this “something” hasn’t slowed down since.
Stay In Touch