
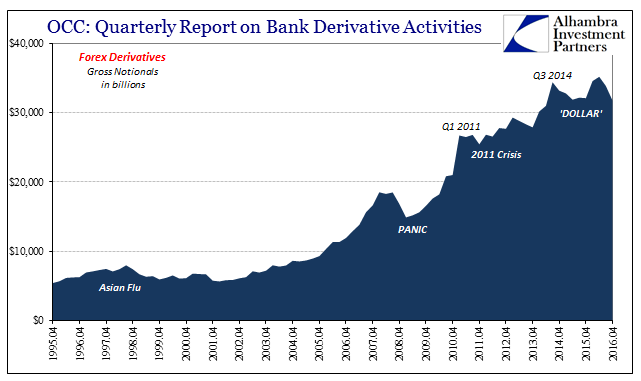
Closing the book on Q4 2016 balance sheet capacity is to review essentially forex volumes. The eurodollar system over the last ten years has turned far more in this direction in addition to it becoming more Asian/Japanese. In fact, the two really go hand in hand given the native situation of Japanese banks. As expected, data compiled by the Office of Comptroller of the Currency (OCC) shows the same negative tendencies in Q4 as over the past few years of the “rising dollar”; in fact, in that quarter more so.
As explained yesterday, notional amounts of any particular bank’s derivative book describes little other than that bank’s behavior as it pertains to the wider concept of balance sheet capacity. It is not a perfect proxy by any means, but it has been very consistent and reliable. Thus, aggregated bank call sheet volumes are as well a good indicator of aggregate wholesale conduct and intention.
In the fourth quarter, reported forex notionals declined sharply to $31.7 trillion from $33.8 trillion in Q3. That is substantially less than the peak in Q3 2014 at the beginning of the “rising dollar”, an altogether unsurprising result because in most ways the abrupt deviation in forex derivatives have been the “rising dollar” (basis swaps and more).
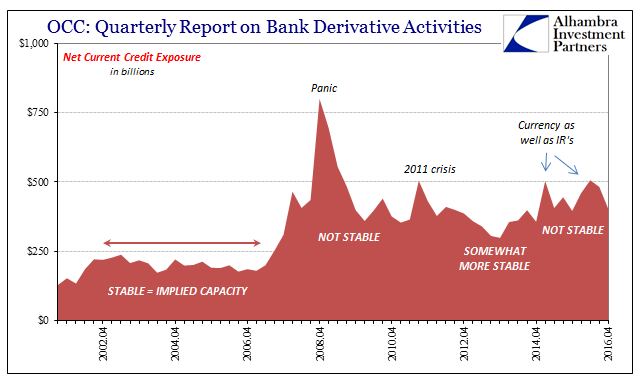
The OCC report is even kind enough to suggest reasons why banks are suddenly shy about this area of global monetary existence. As explained in detail here (it is recommended that you read it first if not familiar with the terminology and meaning of the following section), indicated risk within the systemic derivative book has remained elevated. This despite what should have been relief especially for interest rate swaps due to the bond selloff during those three months. The reported Gross Positive Fair Value (GPFV) was the lowest since Q3 2008, which should have led, all things equal (that never are), to a much more relaxed posture.
But for whatever reasons there remained a lack of systemic capacity to absorb even that smaller amount of potential risk – indicated balance sheet capacity of especially dealers. Net Current Credit Exposure (NCCE) only declined somewhat in Q4 despite that period low in GPFV, remaining substantially elevated with respect to levels from before the “rising dollar.”
It immediately recommends the risk-reduction posture especially in forex; there must be continued reluctance in that space that is keeping NCCE, the lack of fluid and cost efficient netting, higher than it might otherwise be given higher nominal interest rates all around. The “dollar” may not be as much “rising” as it was up until February 2016, but its internals to this point are acting very much as if it was all throughout.
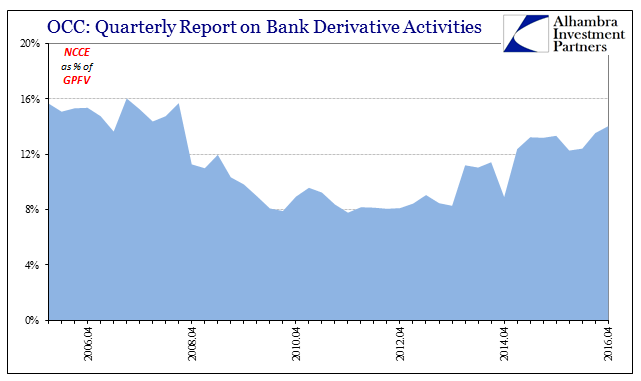
One way to measure this change is to compare NCCE to GPFV, a scaled calculation that tells us how much “credit” risk banks are left with after being able to net out what they can. As you can see below, it has been rising since the end of 2013 coincident to the final descent of bond and eurodollar curves after “Reflation” #2 died out.
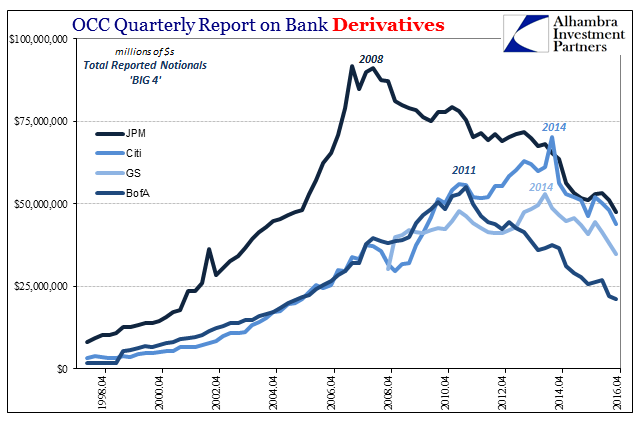
It’s the final piece in what is in several dimensions three interlocking “dollar” events. To put it in terms of comedy, it’s almost like Willy Wonka and the Chocolate Factory where one by one the kids disappear into the various ridiculous traps hidden in each section of the facility. First, the banks, as noted yesterday: JPM disappears in 2008; BofA in 2011; Citi and Goldman Sachs in 2014. By 2016, there is no expansion from any of them, departing from the movie analogy where instead of the economy winning the candy factory we are left with nothing of monetary growth or momentum from any of them.
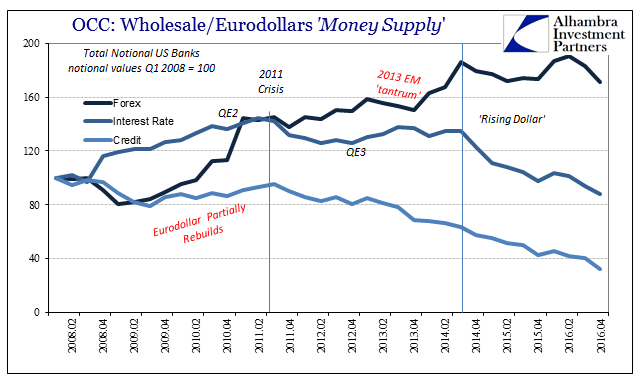
Here is the same by derivative classification: credit products die out in 2008; interest rate swaps in 2011; and forex in 2014. The end result is also the same, leaving no classification supporting the idea of balance sheet expansion even if just in some part.
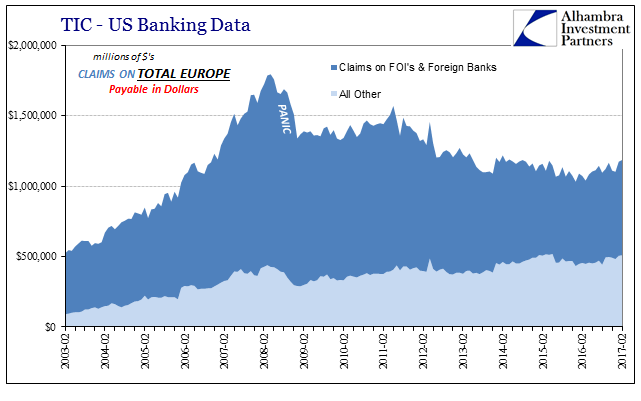
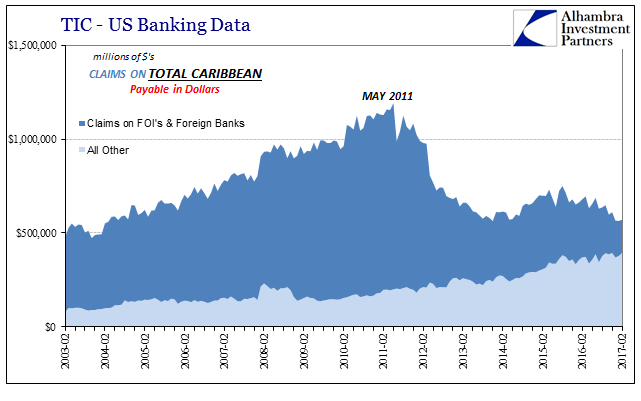
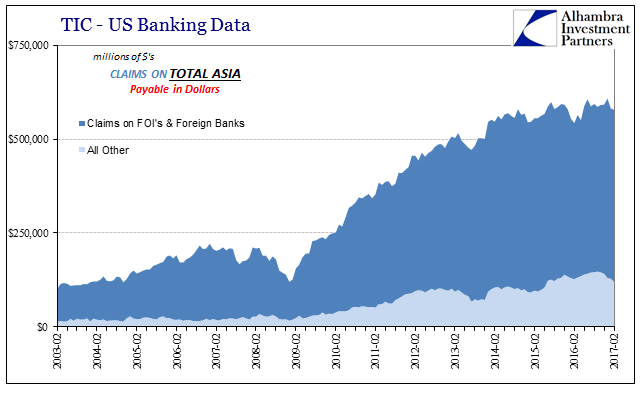
I recounted this same staggered withdrawal in cross-border “dollar” holdings of the traditional kind using TIC data: European banks were gone after 2008; Caribbean offshores after 2011; leaving mostly Asia that has not quite yet fully retreated but is at least no longer adding further balances, either.
The analogy of a noose works well enough, though perhaps that of a ratchet is more appropriate. Every time there is one of these “dollar” events, three so far, it tightens that much more as one or several pieces join others already in retreat. One by one, capacity in whatever dimension gets pared back leaving what I can only classify as the barest of minimum remaining capacity that obviously continues to drag down the whole global economy.
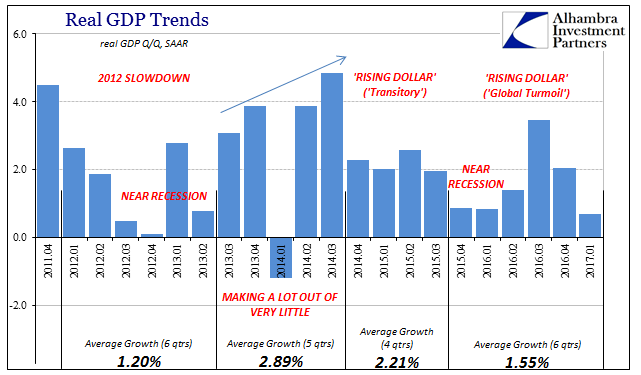
It has been more than a year since the economic trough of last year, and yet there is quite oddly no momentum observed anywhere. This is downright unnatural, as even if there wasn’t a declared global recession at the end of 2015 and to start 2016 there was something close to it. Certainly it was a near-recession to the degree of a serious global downturn. But no symmetry from it can be found anywhere following it. Why?
Every other time throughout history something similar has occurred it is immediately followed by an equal or greater upturn, so that by a year or more later there are no “signs” of improvement or ambiguous data that might indicate the hint of something. If the economy always feels like it is being squeezed or ratcheted it is because we only observe the same thing in the global money that actually counts. As I wrote yesterday:
The defining characteristic is as it has always been, meaning risk vs. reward. In the post-crisis era, the latter has been squeezed and diminished to the point that very little of it remains, leaving asymmetry toward only risk as that sole basis. It is an enormous drag on the global economy, just as monetary issues always have been. In fact, it is practically textbook in its application and nature; it only departs from it in how we define “money” in this 21st century case.
It really is such an easy diagnosis that only pure, unmitigated incompetence could stand in its way.
Stay In Touch