
Back in March 2015, the Federal Open Market Committee (FOMC), the policymaking body of the Federal Reserve, had a problem. In reality at that particular time they had a whole range of problems, but one in particular would set them on their current course. Their overarching task as they define it is to create or foster the best set of circumstances where unemployment can be the lowest possible without triggering wild swings in consumer prices.
This is, of course, the Phillips Curve where today economists believe in a short run tradeoff between unemployment and consumer price inflation. The theory suggests that as more people go back to work there will be fewer left unemployed on the sidelines, so at some magical point the level of remaining “slack” will diminish such that employers will begin competing for employees. Rising demand against lower supply leads to a rise in the price for labor, or wages. As wages rise, spending power does, too, thus consumer prices are set off.
The central bank must therefore decide, if you believe all this, to get ahead of demand so that when that magical point is reached it doesn’t spiral out of control; in the view of orthodox dogma rapidly rising wages are somehow a bad thing. It places a good deal of importance on figuring out ahead of time the level where recovery stops and slack ends. Since monetary policy “tightening” takes time to work, the FOMC must vote in advance of actually seeing that magic point.
As with all things related to economics, it is for economists and policymakers defined by econometrics. An endless series of simulations is run using the most up-to-date data in order to try to anticipate the moment slack disappears and the economy therefore “overheats” into wages then inflation. At the end of 2012, these models predicted a long run “central tendency” for the unemployment rate of between 5.2% and 6.0% that would define what we know as “full employment.” It meant that around 6% the economy should begin showing signs of wage growth and inflation pressures; so that by 5.2% the Fed better have long before started to act in order to stay within its self-defined boundaries of “price stability.”
Almost immediately, however, those projections ran into problems, particularly in the context of QE3 and QE4. The unemployment rate, which stood at 8% in January 2013, dropped much faster than models were anticipating. By September 2013, when “markets” were expecting the first “taper” of QE because of this sudden improvement, the unemployment rate had fallen to just 7.2%. From the Fed’s point of view, under the Phillips Curve, there seemed to be real danger of inflationary pressures breaking out while they were still active under two QE programs.
By the middle of the next year, 2014, the unemployment rate that June had declined all the way to 6.1%. The FOMC, rather than rushing to get out of QE and then frantically “tightening” by “raising rates”, had responded instead by lowering their projected central tendency for unemployment. The upper bound estimate had been reduced from 6% to 5.8% in September 2013, then to 5.6% in March 2014, and again to 5.5% in June 2014. The reason was very simple; the ratio was being moved almost exclusively by its denominator. The BLS figured job growth, but that job growth wasn’t leading as it always had in the past to potential workers entering and re-entering the labor force.
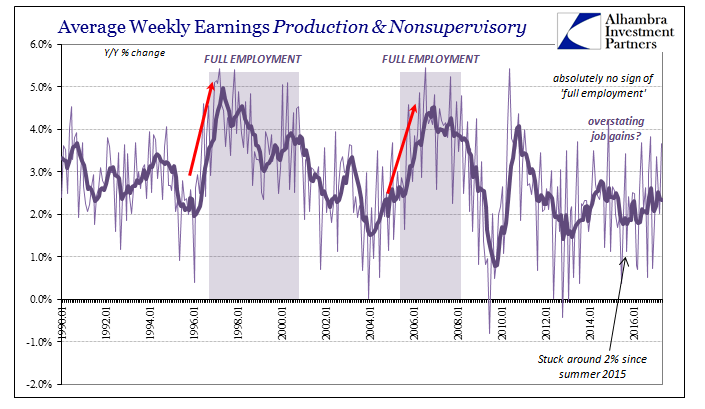
Not only were there no signs of inflation, there were no signs of wage acceleration (despite what was claimed then and almost constantly during the three years that have so far followed), and worse, the overall economy remained in a sluggish, weird sort of state that I’m sure when the FOMC meeting transcripts are released several years from now will show confusion among policymakers, too. Outwardly, they almost uniformly projected as much confidence as they could, but the unemployment rate was, to borrow Greenspan’s phrase, a conundrum.
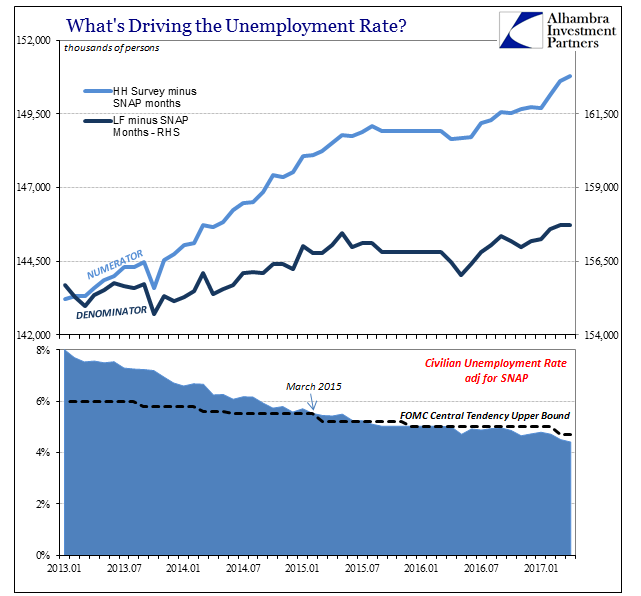
It would come to a head in March 2015, the month where the unemployment rate began to enter even that diminished “central tendency” projecting “full employment.” If it seemed in early 2015 that policymakers were just itching to “raise rates” it was because they were exactly that unnerved. But that year was a complete contradiction, especially given the oil price crash and then even further economic weakness spreading throughout the global economy. The basis for declaring the commodity collapse “transitory” was little more than an unemployment rate that wasn’t even making sense to the econometric models. Small wonder they were wholly unprepared for what came next.
This inconsistency which was expected to diminish over time simply never did. Instead, the unemployment rate drifted well within the modeled central tendency and has remained underneath the upper bound for several years now; even as that upper bound has time and again been further reduced.
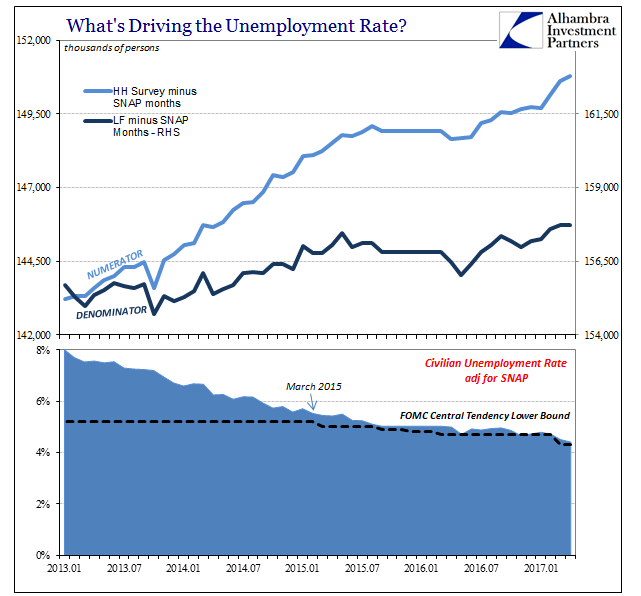
It has become such a glaring conflict that from the middle of last year the unemployment rate threatens to sink right on through the lower bound, too. If the upper bound is the modeled point where the magic might be, the lower bound is where it almost has to be. And yet, there is no magic anywhere, as wage growth remains as subdued as the economy is.
The Fed seems still in a rush to “raise rates”, though for what it can’t really be sure. As of their latest projections, released coincident to the last RHINO in March 2017, the range for “full employment” is now figured to be between 4.3% and 4.7%; a materially different forecast than in December 2012 when it was thought inflation might start with an unemployment rate as high as 6.0%.
What this history shows for those unencumbered by the ideology of the Phillips Curve is that they really have no idea what is going on, or why. This cannot be a scientific pursuit, for they have simply followed the unemployment rate with their projections, leaving them utterly meaningless. The lower it goes, the lower they have to go because even at 4.4%, as currently figured, there is neither inflation (that isn’t insultingly due to oil) nor wage acceleration; therefore, there just cannot be the magic “full employment.”
Because the unemployment rate has moved without the denominator, those joining the labor force, it is entirely unlike anything we have seen before, and at the very least calls for reassessing all assumed relationships. The constant reduction in the modeled central tendency is that same conclusion defined in the language they all actually speak. Janet Yellen often looks (and acts) like a deer caught in headlights because of it, where what were supposed to be the most trusted relationships steadying her economic compass in the right direction have completely broken down.
The latest payroll report simply advances the contradiction for still another month. The unemployment rate falls a little further, closer again to the hugely reduced lower bound, and all the while the labor force refuses to expand and wages remain just as they were throughout these past few years of “full employment” games quite against all historical experience.
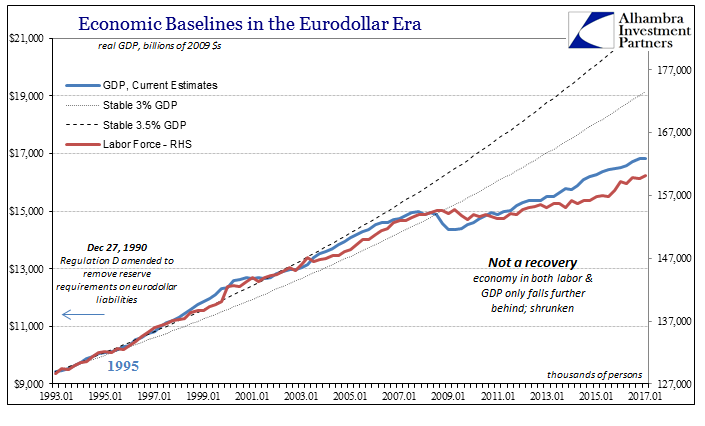
It really should not be so upsetting and startling. The economy is broken, that much should be perfectly clear by now. So it stands to reason much of the relationships and even statistics that used to define its capacity and condition either can’t or are broken, as well.
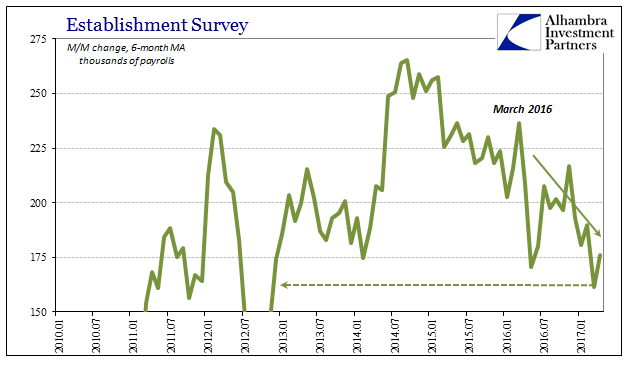
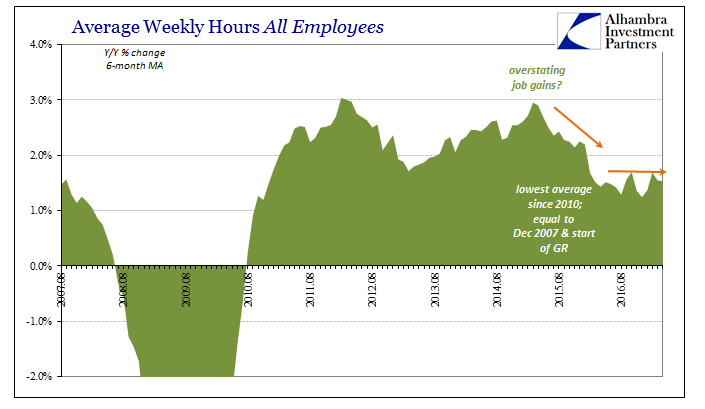
What the rest of the payroll reports suggest is that it continues to be broken if not more so through April 2017. While the unemployment rate falls to new lows, even the Establishment Survey’s payroll gains don’t nearly match the intensity indicated by that result. Other internal estimates continue to lean toward that slowing, or perhaps at best stabilizing in that weaker state.

From the output gap to the central tendency for “full employment”, the FOMC is bombarded with theoretical notions that it better get moving. But that is all they are, old theories, and on some level policymakers surely know it. That is certainly why they hesitated throughout 2015 and 2016, and why they felt it necessary to address continued contradiction, this time in Q1 GDP, in their latest ceremonial duties. The models say it’s time, but even the payroll reports now are a great source of doubt along with everything else including inflation.
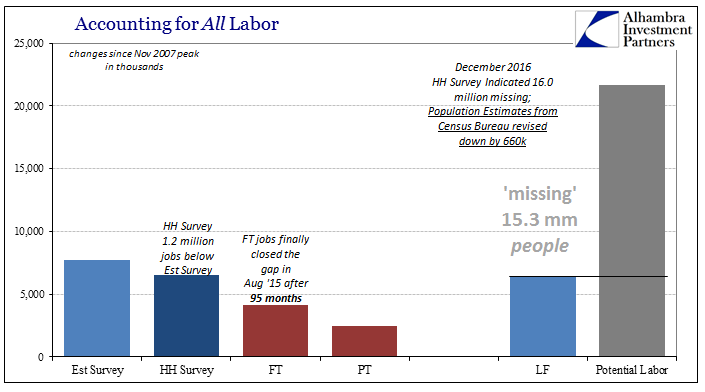
Given that the models are always, always wrong, it should make for easy analysis, an straightforward choice between what is observed and what “should be” but never is. By continuing to move the central tendency lower with the unemployment rate that doesn’t address the participation problem, the FOMC is making it quite clear what is really going on, and it isn’t economics. Try as they might to ignore those 15 million or so missing from the labor data, everything leads back in their direction, as even the regressions are calculating the effects, and the implications, of the economy having shrunk in 2008.
Stay In Touch