
The JOLTS report for June 2017 showed another surge in Job Openings. Hitting a record high, the BLS estimates there were nearly 6.2 million, up sharply from 5.7 million in May. As many in the media like to point out, Janet Yellen has declared Job Openings a favored economic statistics purportedly as a gauge of labor demand.
Why they think that is a selling point can only be related to the mainstream infatuation with credentials. Going back to January 2014, Job Openings have been suggesting an economy that doesn’t exist anywhere else but the unemployment rate. Even the rest of the JOLTS report is far more subdued, having diverged from Yellen’s number more than three years ago.
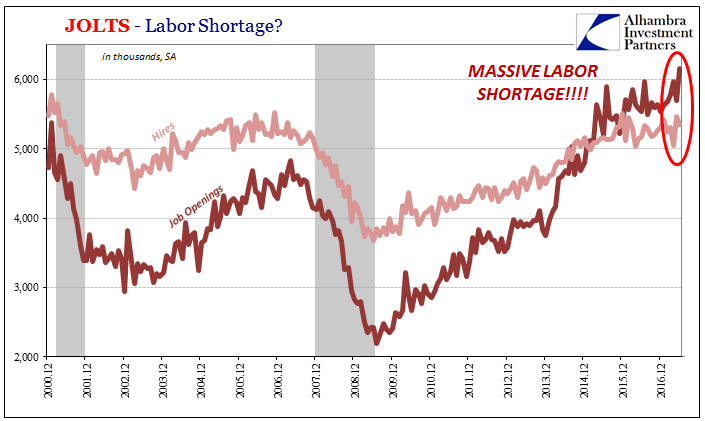
In June, total Hires were figured to be just 5.4 million, down slightly from 5.5 million in May. In truth, those numbers don’t tell us much. Is 5.4 million good? Like the unemployment rate that is a rate, without context you are lost in nothing but immediate relativism.
In other words, to really tell if 5.4 million is what it is so often taken to mean, it has to be anchored to the population. If the American economy engages 5.4 million employees out of a possible labor pool of 100 million, a greater than 5% rate would be unambiguously terrific; out of 254 million it’s not so good.
In March 2007, for example, the BLS in JOLTS estimated there were a similar 5.4 million hires in that month, but there were 23 million fewer potential workers back then. The Civilian Non-institutional population was 231 million at that time where in June 2017 it was 254 million. That yields a Hires rate adjusted for population of 2.33% in 2007 compared to just 2.10% in 2017. Though 23 bps doesn’t sound like much of a difference, the rest of the economic accounts show that it is, in fact, a big one.
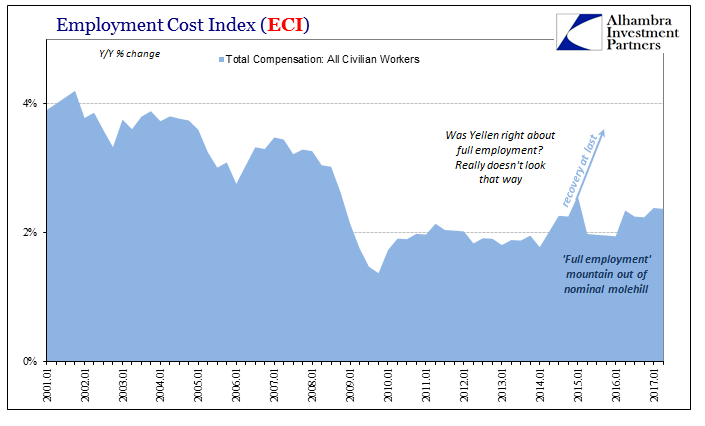
On July 28, the BLS released its update for the Employment Cost Index (ECI) in the second quarter. Job Openings has as a data point been given mainstream attention for its favored status among Fed members only because it conforms to the narrative. The ECI is also a statistic policymakers seek out when analyzing labor market conditions, but because this latter series has been so thoroughly disappointing you wouldn’t know it was also on Yellen’s so-called “dashboard.”
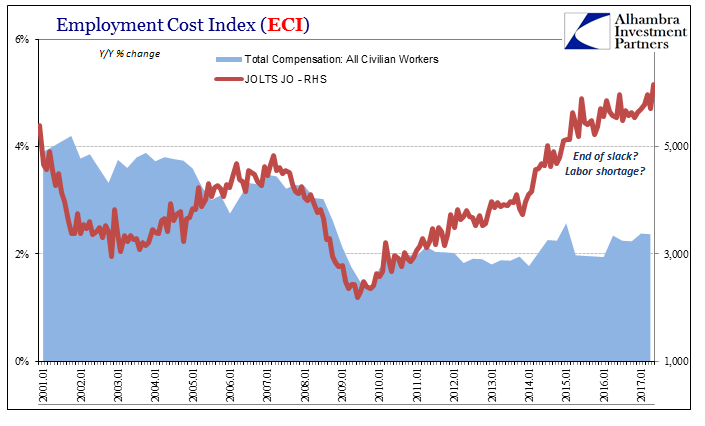
The ECI is actually far more of a relevant indicator of labor conditions because it either confirms or denies Job Openings and the unemployment rate. If Job Openings are an accurate depiction of demand for labor, and the unemployment rate similarly for supply, then the two as of June 2017 propose nothing less than a dire shortage.
As such, simple economics (small “e”) can mean only one thing in that situation – rapid price increases. In labor terms, that is employee compensation including wages but also everything else that comes with a job (health insurance, 401k, etc.). The BLS’s updated ECI for Q2 2017 rose by 2.37% year-over-year, which is actually slightly less than the 2.38% in Q1. It’s not materially different from the 2.34% growth a year ago in Q2 2016 despite all that time with both extreme Job Openings and an unemployment rate.
In Q1 2007, when the Hires rate was 2.33% instead of the 2.10% today, the ECI increased by 3.5%, which was more typical (though still at the lower end) of the pre-crisis period.
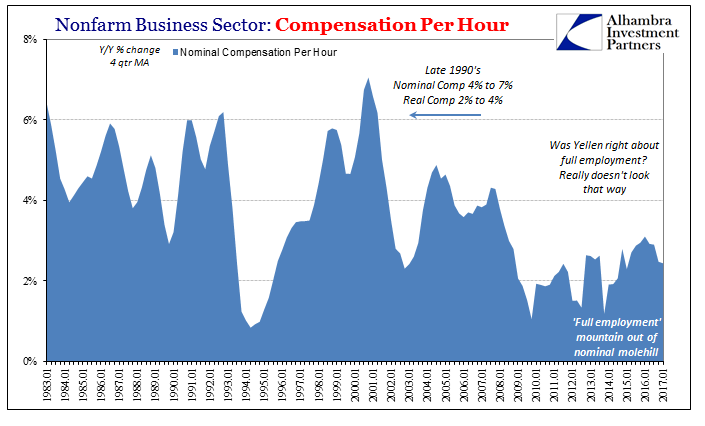
There isn’t the slightest hint that wages and compensation are accelerating let alone doing so rapidly because workers are in such demand. Instead, the ECI, as the payroll figures for weekly earnings, suggests modest improvement (relative to 2009, that is) but no real end in sight to “slack.”
Comparing the JOLTS data to the ECI, it is clear which one receives necessary corroboration, and which one is indicating an economy in the clouds that just isn’t found anywhere else.
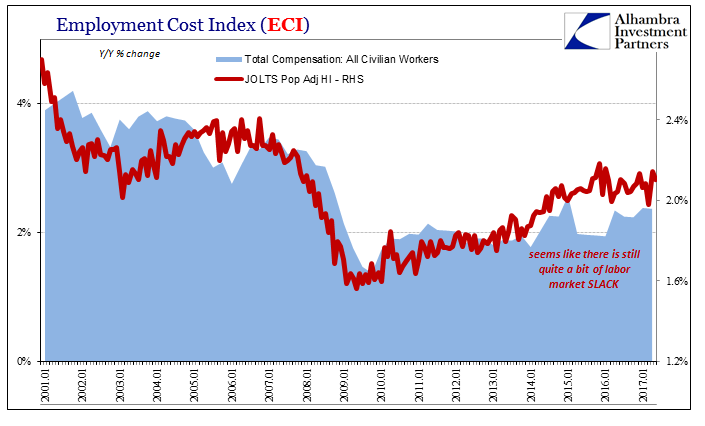
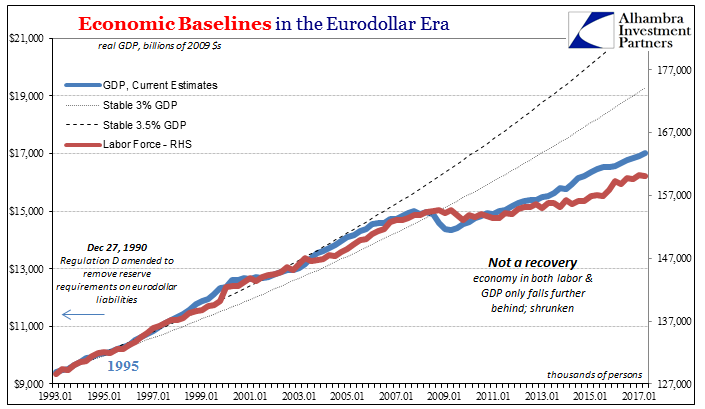
The growth of compensation remains subdued almost surely because there remains a tremendous amount of slack in the labor market – on both sides. This is true of labor demand as well as supply. The unemployment rate totally discounts officially on the supply side many millions (perhaps as many as 16 million) who might otherwise be working if the economy hadn’t shrunk in 2008-09. On the demand side, the adjusted Hires rate shows there isn’t really a robust appetite for additional labor utilization, either.
The net result is a lackluster, depression-like economy that can’t ever seem to really get going; and so often (twice so far; 2012, 2015-16) closer to outright recession instead. If Janet Yellen considers Job Openings an important data point, that actually makes quite a lot of sense for the past three years.
Stay In Touch