
The unemployment rate, I’m sorry to report, didn’t tumble all the way to zero. Pity. It did stay at 4.1% for the fourth straight month. Because of that, wage pressures should be exploding right now. That seems to be the verdict in markets this morning, a rumble of inflation shot right through everything at the release of the payroll report. Unsurprisingly, it’s not actually what the BLS data shows.
The underlying figures have instead been displaying the exact opposite tendency from inflation. There is weakness all over these reports, constant weakness, too. Not only are wage pressures conspicuously absent, in January 2018 the numbers in question all pointed toward inarguably subdued conditions.
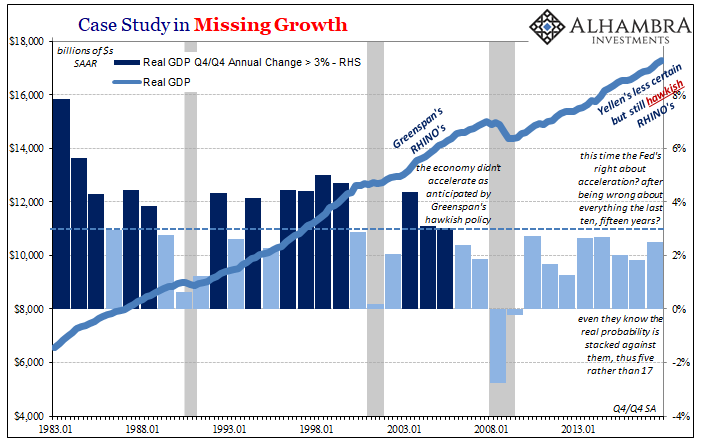
First, we need to understand that time is an important component. According to the best estimates of the most sophisticated econometric models, those of the Federal Reserve, wage pressures should have started building when the unemployment rate fell into its central tendency range. That was at the start of 2015, three years ago now.
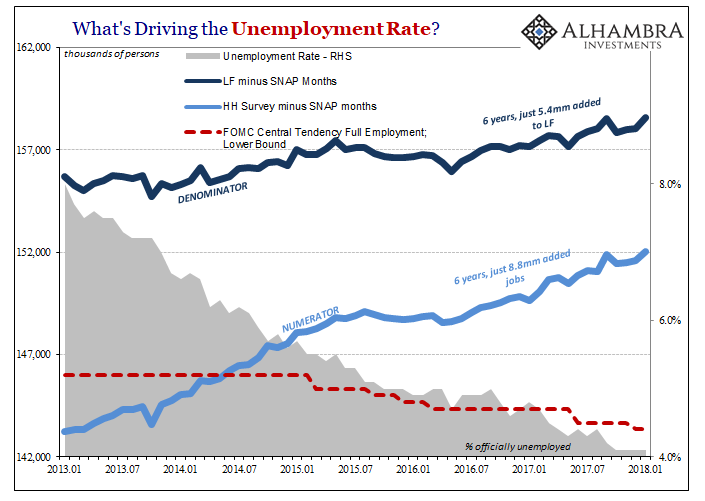
What that means is that if the regressions were at all correct, something would have happened long before today. Three years is more than enough time; for the American workforce and the US economy it’s a lifetime.
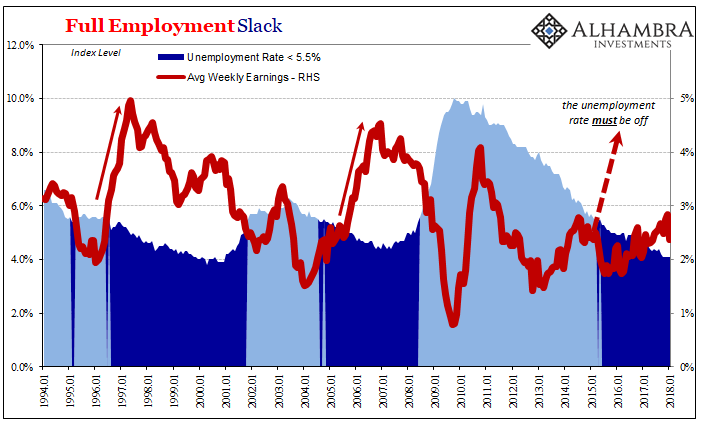
Instead, the Fed keeps moving the goalposts, a sign of confusion not confidence. They have constantly lowered (above) their estimate for where wage pressures should begin to blow out because wage pressures never do. Now that the unemployment rate is safely below their lower bound for “full employment”, there really is no argument left. That’s why it’s a pity the unemployment rate didn’t drop to zero, because in actuality in this economy there is no difference between 0% and 4.1%. They would both be nonsense.
There should be something to 4.1%, which is what everyone is so hung up on. That plus a nice round number of 200k, and it seems downright reasonable to ask, how is this not awesome?
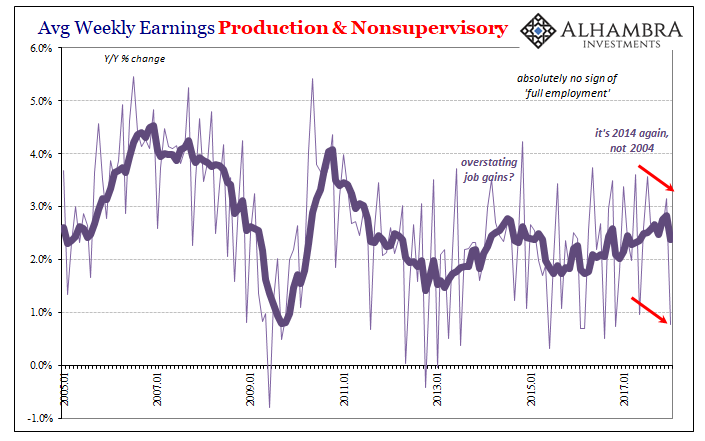
The BLS estimates that the average weekly earnings of production and non-supervisory employees gained all of 0.8% in January (year-over-year). The series does tend to be quite noisy month to month, and it’s not uncommon for low growth to intersperse with often higher growth months. But 0.8% is unusually weak, the lowest in fourteen months going back to November 2016, and for the past eight months average weekly earnings are trending lower, not higher.
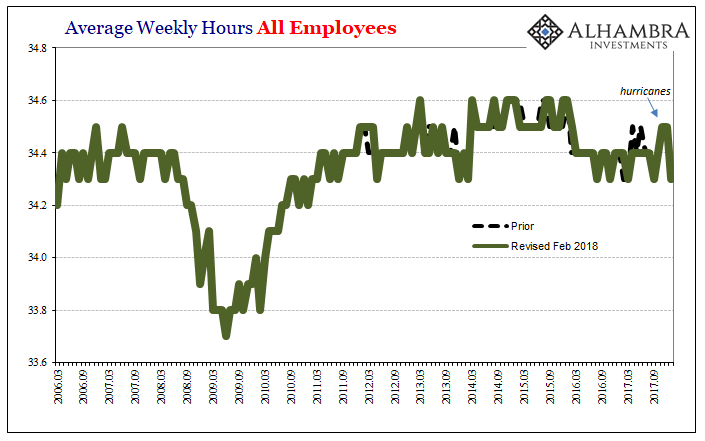
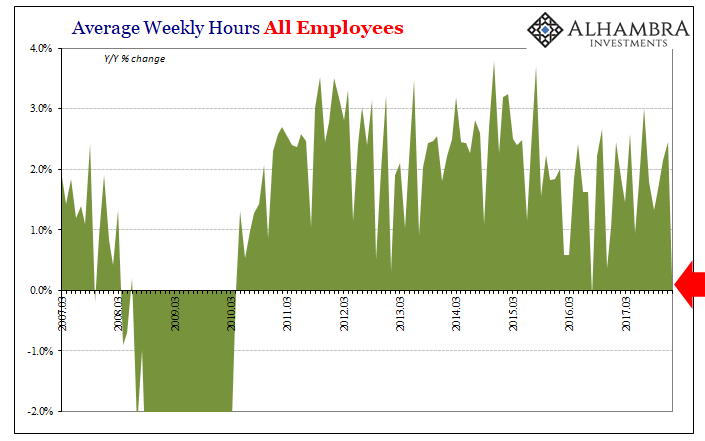
The reason why further undercuts the boom narrative. Average hours declined to 33.3 per week in January. Benchmark revisions (annual) to the series have removed the prior upturns in hours, save the one for October and November almost certainly due to the aftermath and pickup from Harvey and Irma.
Now past those anomalies, the baseline for labor utilization is starkly weaker than the unemployment rate suggests. Total hours, the aggregate level of labor utilization, were nearly flat year-over-year in January. Rising just 0.2%, that’s the second worst month since 2010. It is again consistent with, of all things, rising revolving consumer credit in the back half of last year.
It’s yet another indication that 2018 is off to a very sluggish start (a weak Q1, imagine that) and therefore 2017, as bad as it was for the labor market and economy in general, could end up being as good as it gets. What wage inflation is going to develop from this kind of employment background?
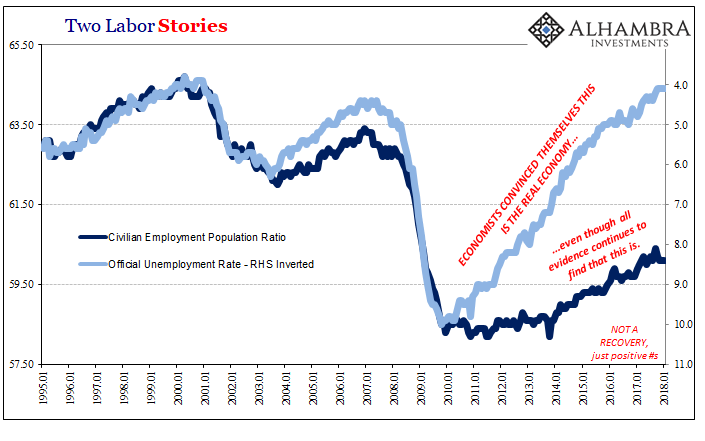
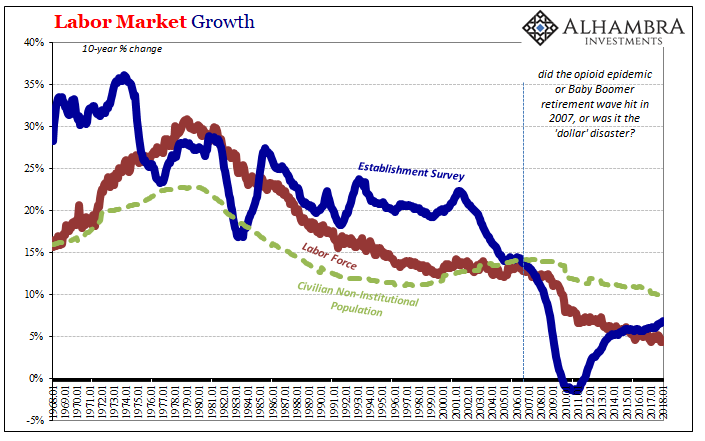
It bears repeating with every single payroll report that the problem is still 2008. Ten years after the labor market in the US started to shrink, it has never recovered. Not even close. That’s how a 4.1% unemployment rate can reduce itself to nothingness, the equivalent interpretation to meaninglessness. This one fact alone explains why for three years Economists and FOMC officials have been in vain predicting always future bouts of wage-driven inflation that just can’t happen.
The more immediate problem is narrative in nature. People see and hear about the 200k in payrolls estimated to have been added by a booming US economy. No one ever stops to ask, is 200k even a good number? On the surface it seems like it is, there are five zeroes in it and a plus sign in front, and if everyone else thinks so it must be true.
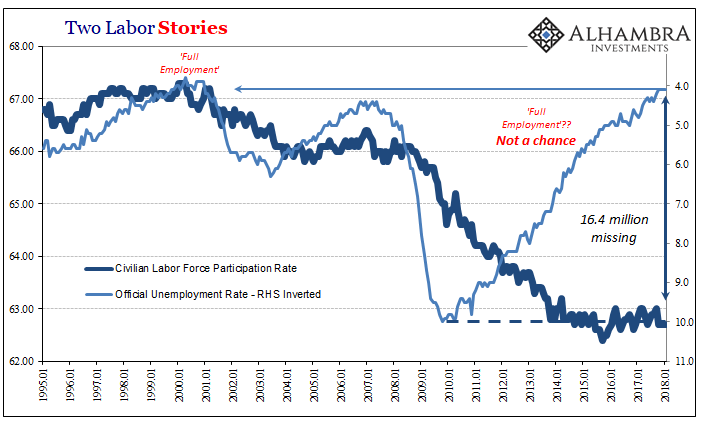
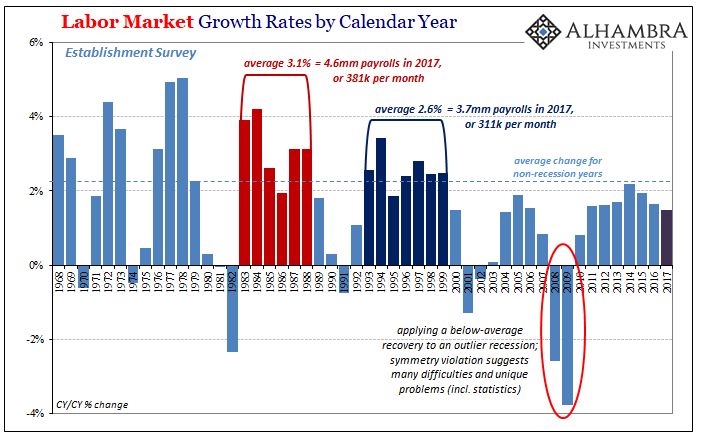
In reality, 200k is well below what’s needed for minimal economic gains, let alone anything like a boom. On baseline considerations alone, payrolls should be expanding by at least 300k on average. And that would still be relatively weak. Combined with the participation problem due to the shrinking economy back ten years ago, the Establishment Survey would be recording 400k if not 500k in average monthly growth just to get back toward the pre-crisis trend (which wasn’t all that good to begin with).
That’s not how everything is being characterized, of course. The annual benchmark revisions to the Establishment Survey added 118k to 2017’s total. The BLS now figures US employers added 2.173 million jobs last year, and that in January payroll expansion reached a record 88 straight months.
Like the headline, both of those numbers sound terrific, substantial even. They aren’t. Two million jobs are more than a million and a half short of an actually good year in the labor market. The length of time without a negative number is far less impressive when you realize those positive numbers weren’t very positive the whole time (even the best year, 2014, was below average).
This is how you get no wage growth from a 4.1% unemployment rate, as well as slowing and fragile labor utilization (hours) consistent with a much different economy than a booming one. Yet, for some reason people still look to the FOMC and its models as if everything is about to change next month. Time is inverted, meaning that the longer this goes without what everyone is so sure of, the more certain they become.
That, even more than calling 200k good, explains a lot.
Stay In Touch