
The National Association of Realtors is confused. The trade group for real estate professionals and salespeople just reported a significant drop in the level of resales for January 2018. After peaking at an annual pace of 5.72 million (revised) in November, existing home sales declined to 5.56 million (revised) in December and now just 5.38 million last month. That’s the lowest level since September 2017, more like mid-2016 than even close to a healthy trend.
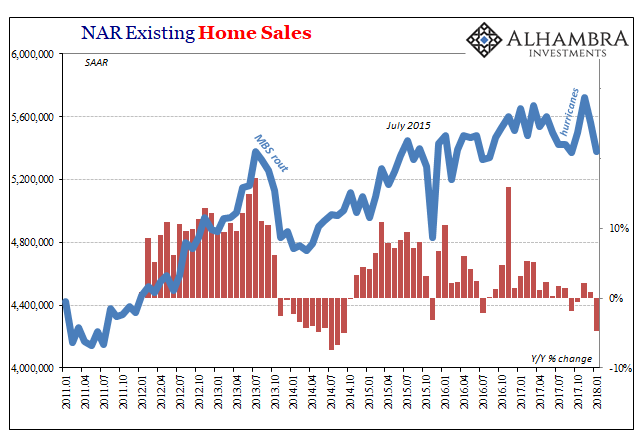
In their press release, the NAR makes no mention of Harvey nor Irma. Despite the clear association, the artificial boost in those two months following the storms, there isn’t an acknowledgement as to how the housing market was noticeably weak for several months before the hurricanes struck. January 2018’s estimate is almost perfectly in line with that prior trend.
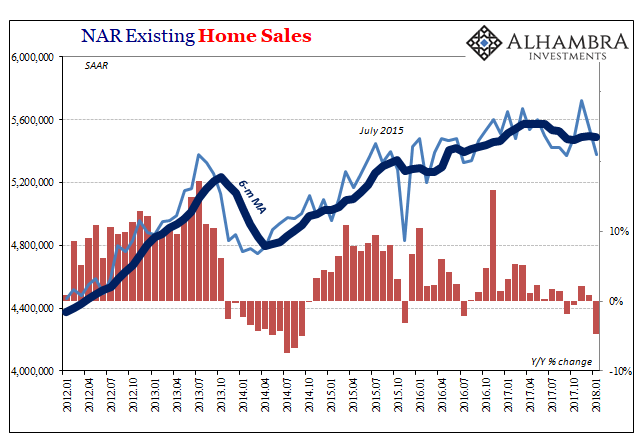
The 6-month average for resales shows better the overall state of the real estate market. It’s not horrible by any stretch, but it’s also not growing, either. This is the primary problem because by all outward projections it should be. Not only should the level be accelerating, there would also be new record high sales volume with each monthly gain.
This market has stalled, and the realtors group can’t figure why; except to acknowledge what is perfectly obvious from their own data.
The utter lack of sufficient housing supply and its influence on higher home prices muted overall sales activity in much of the U.S. last month…It’s very clear that too many markets right now are becoming less affordable and desperately need more new listings to calm the speedy price growth.
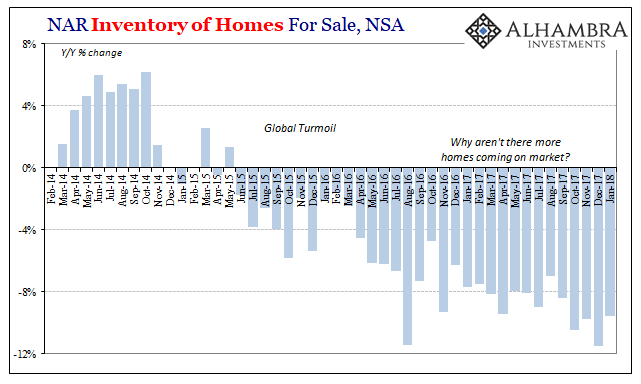
Huh? There are buyers who are motivated, even desperate, to purchase, yet no one wants to sell to them even though prices are “speedy?” Something is clearly missing here, though the NAR’s chief economists can’t seem to figure what it might be.
Another month of solid price gains underlines this ongoing trend of strong demand and weak supply. The underproduction of single-family homes over the last decade has played a predominant role in the current inventory crisis that is weighing on affordability.
Any kind of squeeze or bottleneck like this is what economists call “cost-push” inflation, except in this case the process is somewhat different. In general terms, under a cost-push scenario the price of inputs rises sharply which has the effect of reducing aggregate supply. The result is rising prices for end users because of the developing bottleneck.
What we are likely seeing here in the real estate market is the same end result. The squeeze has developed not on any tangible increase for input costs, but rather in the intangible perceptions of prospective home sellers. In other words, the benefit of selling one’s existing home is quite clear and obvious – inflated value. The cost of doing so is what follows from it, meaning in all likelihood a higher mortgage payment for making the move to the next house.
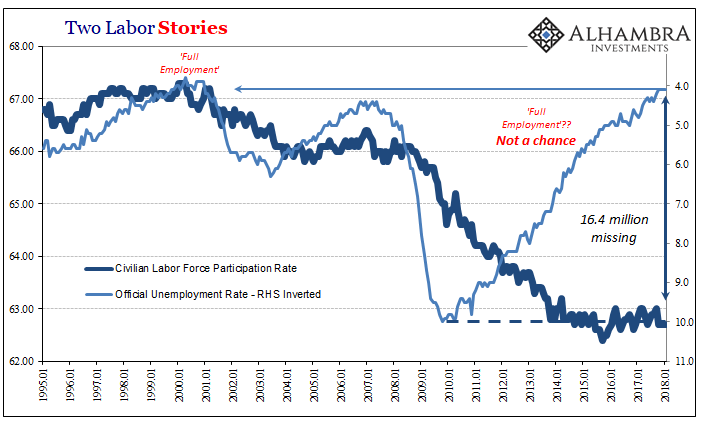
If the labor market was truly robust and the economy consistent with it, the perceived costs of making the trade are low. If instead the labor market is unsteady or worse, those costs rise particularly in the minds of those most directly affected by weak economic conditions.
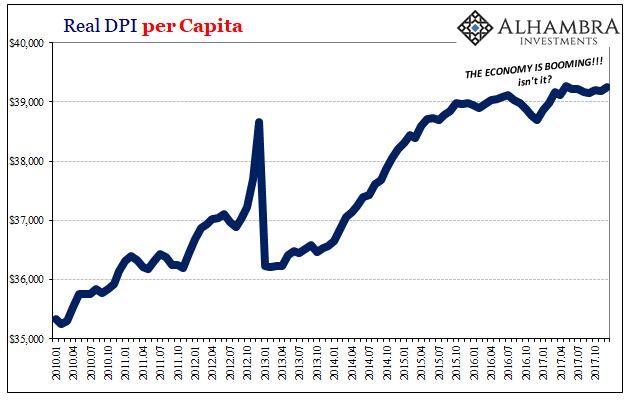
Therefore, house prices rise because of the cost-push squeeze or bottleneck. Even if the price of your house is up, maybe even way up, you don’t do it. The feared costs outweigh the tangible benefit. The only factor that explains everything is a weak economy and labor market.
Any economy is a mix of healthy and unhealthy. The demand for housing, new and existing, is derived from the part that is healthy. Even in the worst of recessions the vast majority of the population remains unaffected by it. The issue is the size of the margins, meaning the proportion of the population left on the wrong side of that divide. A healthy economy has far fewer.
A recession in these terms is where there are far too many who all at once find themselves in that state. The weak economy we still have today is still far too many on the wrong side, only that they’ve been there for a long time and now many more are starting to worry in aftermath of the “unexpected” 2015-16 downturn they might fall into the same category.
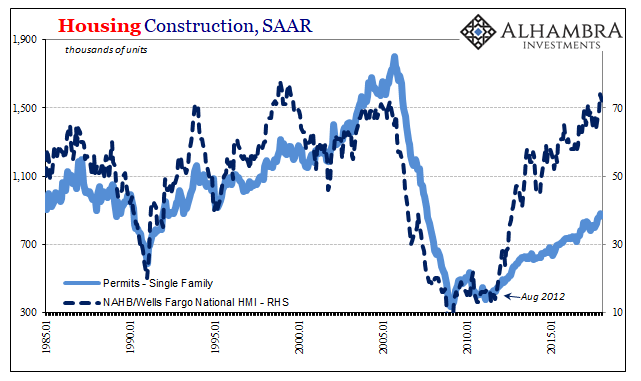
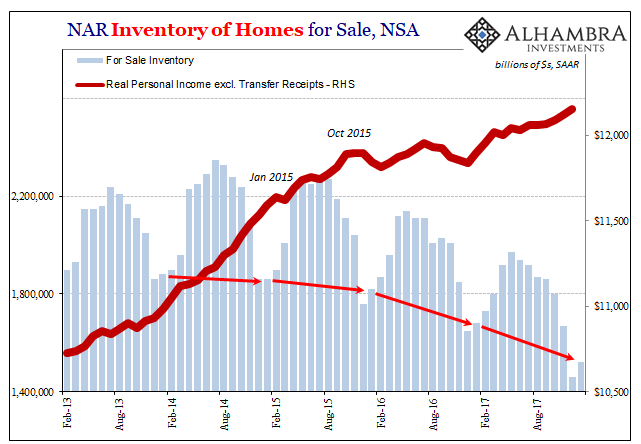
That’s how we get the “underproduction of single-family homes over the last decade” and now at the same time contracting inventory. It is, in fact, the only way to explain both of those things.
But that’s not the narrative, so Economists are left to puzzle over what is really quite simple. That’s why it’s not a science but an ideology. A truly scientific pursuit doesn’t work backward from a preconceived conclusion.
In addition, they now have to deal with the aftermath of the storms’ aftermath. A whole host of economic statistics were boosted, some to a ridiculous degree (which should have been a clue), immediately following Harvey and Irma in predictable fashion. It seems quite clear that many in a rush to “find” evidence of this so-called boom might have been too quick to see that for what it wasn’t.
Each passing month, however, increasingly confirms that in whatever data series the baseline never really shifted to the September-November trend. We should expect to find, like resales, incoming data further away from this distortion more in line with last summer than last autumn.
The combination of last fall’s artificial jump in several key accounts plus the belated passage of tax reform seems to have turbocharged what was a more hopeful if still somewhat rational discussion of possible “globally synchronized growth” into an irrational hysteria of inflation and this boom. There hasn’t been any of either, and as more data sinks back to reality that should start to sink in for all but the hopelessly rationalizing.

Stay In Touch