
The background for inflation hysteria was pretty simple. Globally synchronized growth meant acceleration in the US economy which would raise demand for labor. The unemployment rate, faulty as it has been, suggests that any further increase in labor utilization would just have to pressure wages – the competition for workers rises as the marginal supply of them dwindles further downward (slack). Rising wages would mean rising pay and then consumer prices, therefore a more aggressive Federal Reserve that blows up the bond market.
Hysteria.
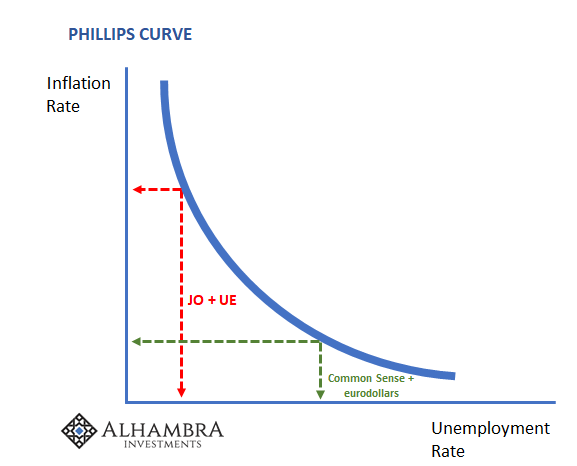
In the middle of all that is the Phillips Curve. Plotted as a simple relationship between the unemployment rate and consumer price inflation, it endures because there is just that sort of intuitive relationship in any economy. Its more extreme forms, such as the idea of an exploitable Phillips Curve, first raised by Keynesian economists Paul Samuelson and Robert Solow in 1960, has been thoroughly discredited. You can’t, as they presumed, “buy” a lower unemployment rate through tolerating or even trying to stoke a little more inflation.
That’s not what those economists were really after, of course. Paul Samuelson had written a book in 1947 which was the basis for pretty much everything that has followed since. Economists since before the industrial age have obsessed over finding the mathematical rules behind every economic process, therefore economy. Given the right equations, they believe, a whole economic system may be precisely mapped and then governed to its optimal solution sets (determined, of course, by the economists).
Foundations of Economic Analysis was meant to be a break from classical theory, as Samuelson wrote in its introduction:
The laborious literary working-over of essentially simple mathematical concepts such as is characteristic of much of modern economic theory is not only unrewarding from the standpoint of advancing the science, but involves as well mental gymnastics of a particularly depraved type.
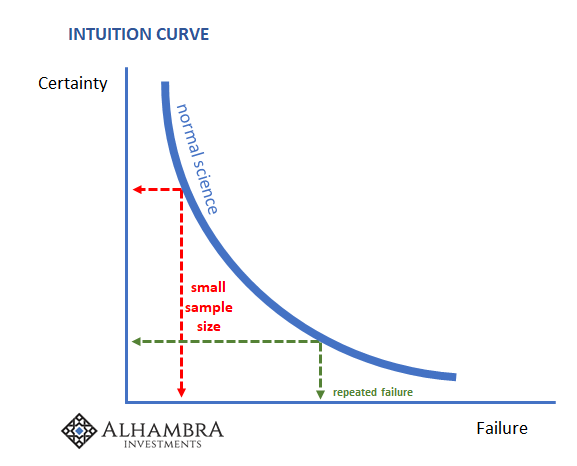
Failure in science is a good thing, a process by which we learn about the real world as it is. In the laboratory, the downside is merely time and material, the necessary minor inconveniences to progress. In economics, it’s become a whole other story.
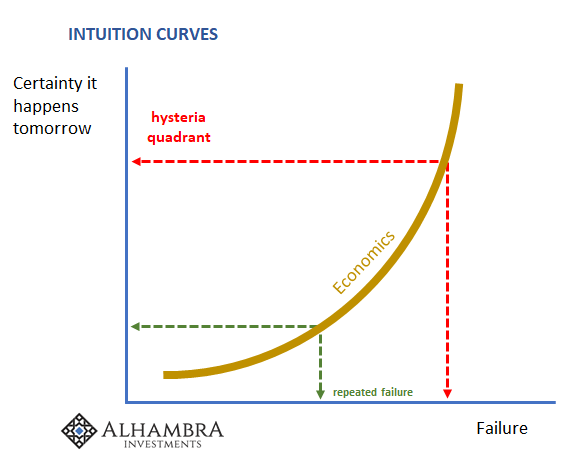
Translated into 21st century econometrics, it means that no matter what happens to an economy from intended policy inputs (primarily of the monetary policy variety) the equations never fail. In a real science, failure causes re-evaluation and the search for alternate theories and eventually the right answer. In Economics, there is always, always tomorrow.
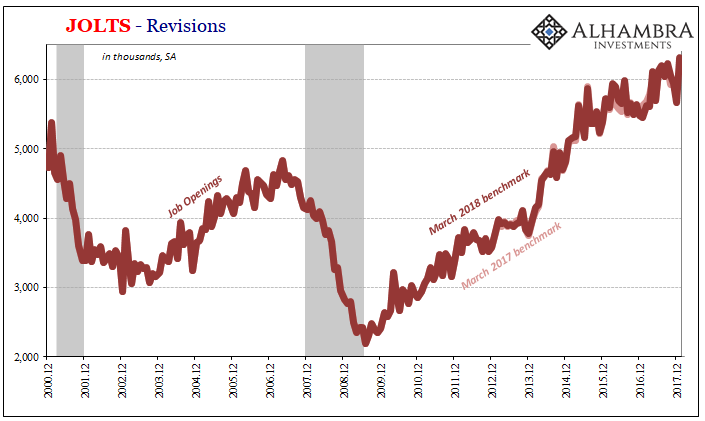
One particularly noisy proxy for labor demand of late has been the BLS’s JOLTS survey for Job Openings (JO). I don’t mean “noisy” in the statistical sense, rather in the manner of this recent hysteria. JO has been quite well-behaved in its own right, and that’s the problem.
Starting at the beginning of 2014, the estimated level of job openings in the US economy absolutely surged. As a proxy for labor demand, it conformed to expectations regarding first monetary policy (QE3) and then the surviving remnants of the Phillips Curve.
Inflation was upon us surely by 2015 at the latest. Federal Reserve officials prepared to lay the groundwork for it by tapering QE to nothing and then plotting their dots to liftoff into normality. Everything was taken in the media as fait accompli.
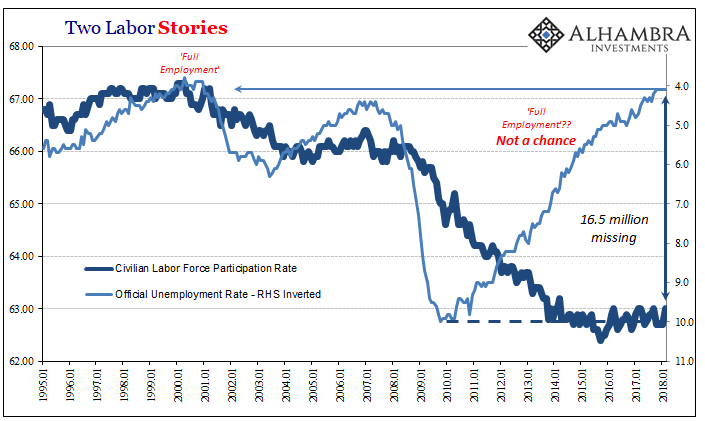
That was four years ago. Four. JO remains elevated still, suggesting that for almost half a decade the labor market has been on fire. During that time, the unemployment rate has further declined such that of late it is substantially below the underside of every guess as to full employment.
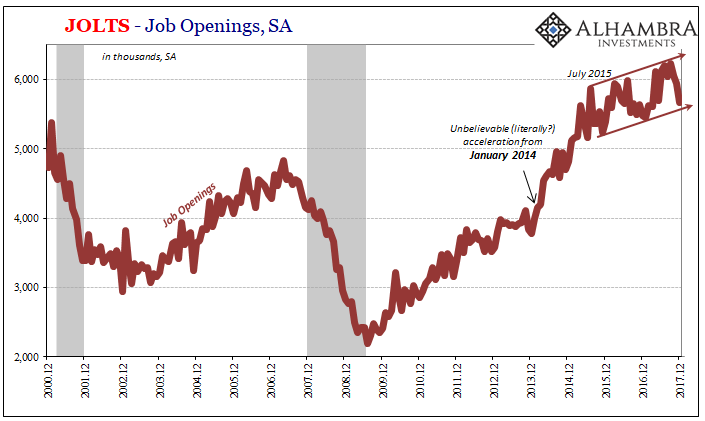
The one quirk in JO has been this shift dating back to the middle of 2015. It appears to be a slowing, revealed a little more clearly by recent benchmark revisions (it’s the beginning of revisions season). To many economists, that bend in the trend is either the natural plateau of full employment, or it’s the byproduct of fentanyl (or just marijuana, given how many anecdotes complain about drug testing prospective employees). This is the labor shortage we’ve been hearing about.
Given the econometric attachment between the problem in the labor market and what’s expected to result in the bond market, BOND ROUT!!!!, this has to have taken on more proper proportions last year and this one; meaning, LABOR SHORTAGE!!!!
There is, as always in this economy, a flipside. Standing starkly against it is the regular monthly churn of actual hiring. According also to JOLTS, though demand might be high in JO companies aren’t actually engaging further upon that demand in HI.
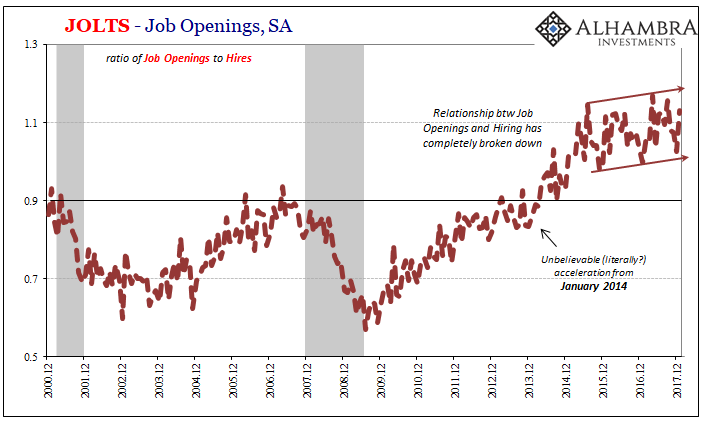
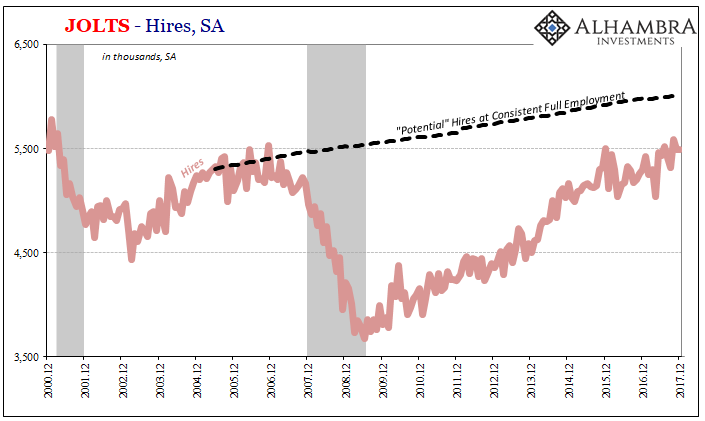
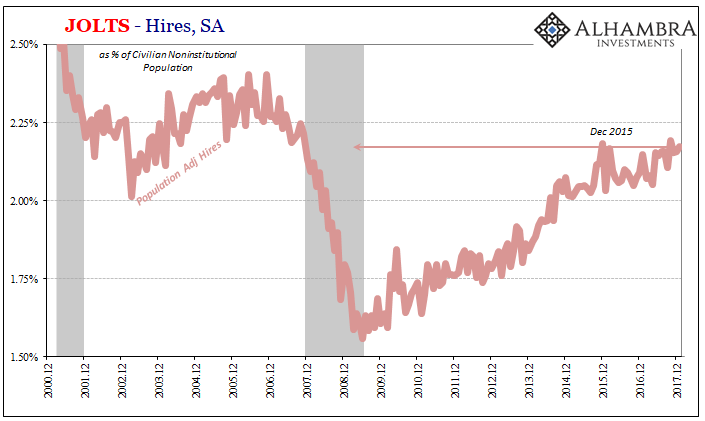
This disparity is even greater than it might otherwise appear. Adjusting for population growth, hiring activity is clearly restrained post-crisis despite otherwise recovery mechanics. The mainstream LABOR SHORTAGE!!!! explanation describes the difference in the same way – businesses want more labor but just can’t find enough qualified employees.
The Phillips Curve says, however, if that is true then wages and consumer prices should be way beyond liftoff by now. But if we go looking for it, we can’t find it, even after four years. Four.
Consumer price inflation is one of the most studied areas of both economics and Economics. That’s understandable given the intuitive sense behind the Phillips Curve. There is some relationship between employment levels and consumer price changes; there has to be. Whether Economists know enough about them to be successful in their quest for precision leading to marginal economic control is another matter.
The same government agency that tabulates all the labor statistics, the BLS, is quite purposefully the same one that produces the CPI. Though the PCE Deflator, a consumer creature of the BEA, has supplanted it in monetary policy decisions, the CPI was their first guinea pig. It has been sliced up and pulled apart in all manner of ways, different subsets that were designed to tell us about discrete pieces of relevant processes.
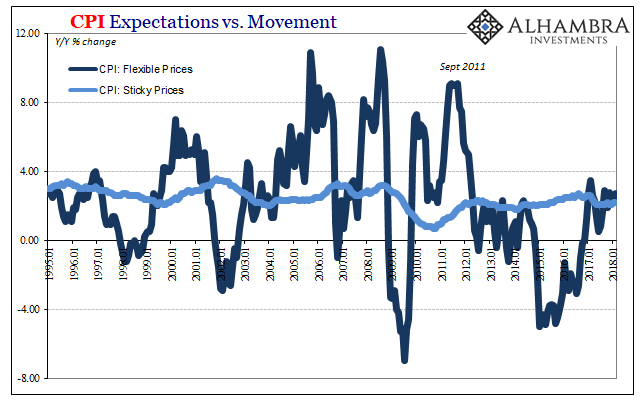
Two of those relate to flexible and sticky prices. The latter is a CPI subset of goods whose prices don’t change all that much. It is surmised they remain sticky because there are costs and frictions involved in raising or even reducing them. Therefore, sticky prices can be a proxy for inflation expectations as well as how those expectations might relate to the Phillips Curve.
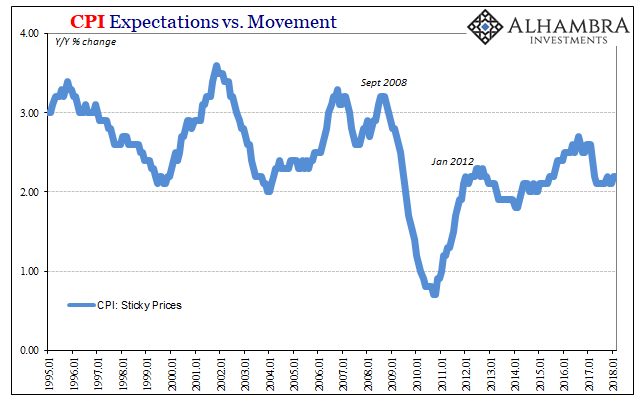
Not surprisingly, at least if you are not a practicing econometrician, sticky prices have tended to remain lower after 2008 than before. There has been some noticeable relationship between them and average weekly earnings growth, for example, further proposing once again those looser Phillips Curve qualities.
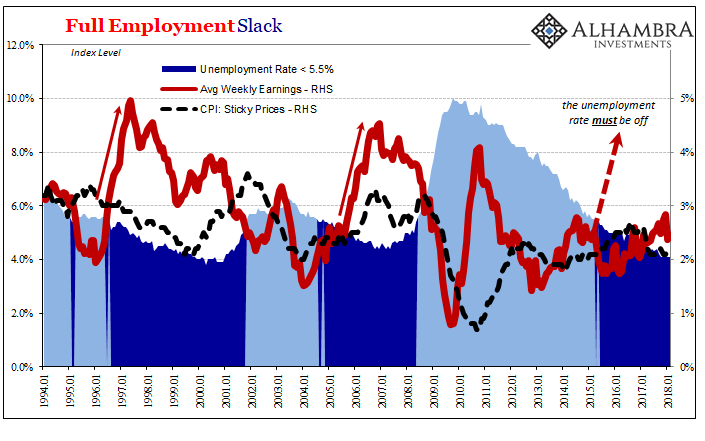
As wage growth has remained subdued since 2012, no matter JO or the unemployment rate, so have sticky prices.
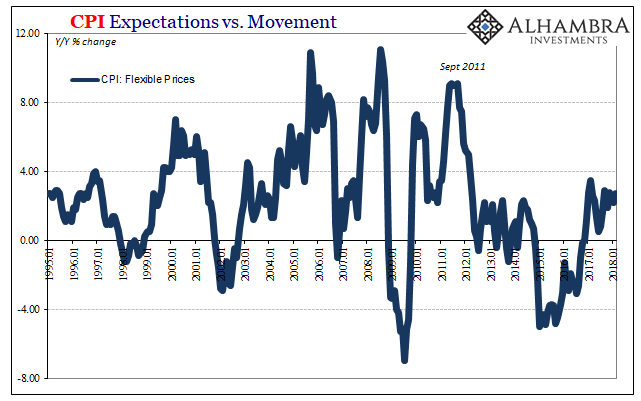
On the other side, flexible prices, these are the goods in the CPI basket more susceptible to immediate macro processes – like downturns and upturns, but also effective rather than theorized monetary conditions. Just as sticky prices are restrained the last ten years, flexible prices are that to a much greater (meaning more obvious) degree.
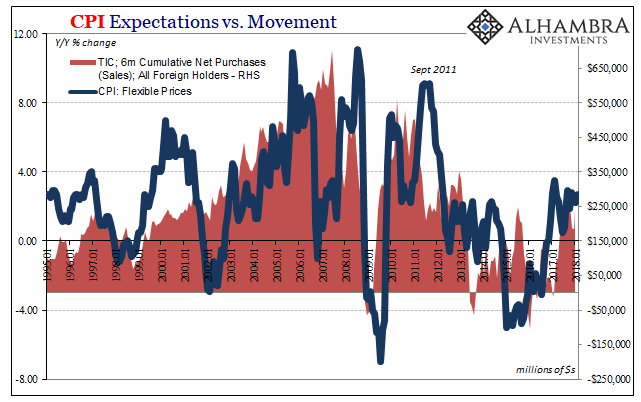
Not only that, the general trend in flexible prices is exactly how you would imagine given an understanding of basic eurodollar trends. Using a proxy for offshore money like TIC (net purchases/sales of US financial assets by foreign holders), the CPI here is less about the Phillips Curve and more clearly money.
It doesn’t further discredit the mainstream use of what’s left of the Phillips Curve, rather it reaffirms it to some reasonable degree. The problem isn’t the expected relationship between unemployment and consumer prices through wages, it’s JO and the unemployment rate. They are quite clearly sending out false signals and therefore creating unreliable interpretations of them – both in common sense as well as econometrics.
Inflation hysteria especially in later 2017 was as much a product of time as those false signals. The rise in oil prices as natural economic processes off the bottom of the 2015-16 downturn was likewise misinterpreted (or disingenuously associated) as relating to the labor market instead of partial monetary “reflation.” It was made into something it wasn’t.
And since economics is not really a science, the more failure piles up over time, the more certain Economists become of (and the media feeds) the hysteria. Inflation is subdued because the monetary system is a drag and therefore the economy is subdued and so is the labor market. The Phillips Curve diagram might still apply, only nobody really knows just where to draw the curves on them.
The only relevant part of the JO series is that plateau. It’s not drugs or an aggregation of too many unskilled laborers in the labor pool, and it’s nothing like full employment, rather even in this one high flying data point the “rising dollar’s” influence can’t be dismissed. The timing of the inflection shouldn’t be, either.
Seventy years after Foundations, Economists have fallen in love with their mathematics even though the big problem is more basic. Even the most elegant of equations are subject to GIGO – garbage in, garbage out. If you input the current figures on JO plus those for the unemployment rate into any Phillips Curve what’s going to come out is pure nonsense. To so vehemently and emotionally believe in that noise is not science, it’s appropriately classified as hysteria.
Stay In Touch