
JOLTS is at it again. The most-watched piece, Job Openings, has been surging. Ostensibly an attempt to measure the demand for labor in the private economy, the BLS figures that US businesses are in the market for whole lot of new workers. Given rising worries throughout the uncertainty of 2018, JOLTS JO has been used as a steady counterpoint.
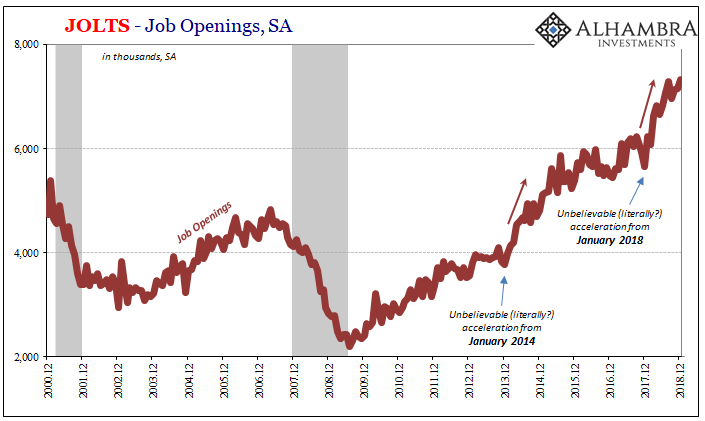
This isn’t the first time. The level of Job Openings leaped in 2014, too. As economic uneasiness built through the end of that year and then accelerated (into a downturn, no less) in 2015, the same thing. The US economy was steady, booming even, as told by JO. By 2016, instead, it became clear something was amiss.
The BLS, however, holds no monopoly over statistics about job openings. The Conference Board produces a different set based solely upon online Help Wanted ads (HWOL). As with JOLTS, this alternate data proposes to measure the demand for labor. Only, around 2015 this other series encountered difficulties with Craigslist:
Because the online listing site charged nothing for ads including Help Wanted ads (outside of New York and LA metro areas), it grew to become the largest source of online employment listings. It began to charge for listings in other metro areas as soon as 2007 and 2008, expanding those charges to a wider variety of cities in 2012, 2013, 2014, and 2015. For some metro areas, the fees were almost doubled at the end of 2015.
As a result, the HWOL series slowed during 2015 and then collapsed to begin 2016 – according to them, not for macro conditions. Over the last two years, the group has reworked HWOL into what they call an experimental index. It still shows the flagging rate in online Help Wanted ads during that last downturn, but not nearly to the same extent after having accounted for Craigslist dynamics.
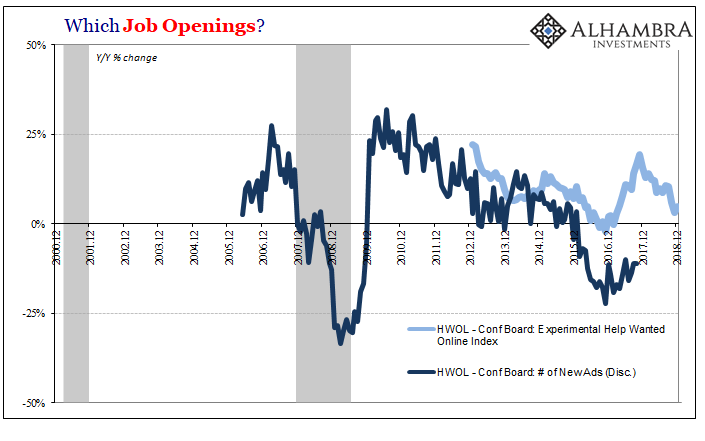
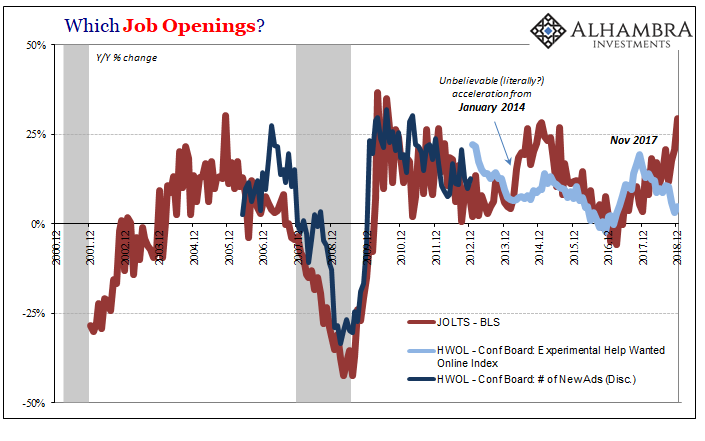
Difficulties aside, the new index performs generally the same as the old one; as in, it very much disagrees with the BLS’s version on these last two upswings. Both of them.
Just like 2014 and 2015, for all of 2018 the Conference Board’s HWOL slowed down remarkably. As you’ve probably heard, the JOLTS JO has done the exact opposite, skyrocketing in acceleration. Two very different interpretations of what are supposed to be the same idea.
Is demand for labor through the roof, proving the unemployment rate and therefore pushing the Fed back to its prior Phillips Curve hawk position? Or, demand for labor slowing dramatically as the US economy doesn’t decouple and is pulled inexorably toward another downturn by the same dramatic negatives as exhibited by the rest of the world?
It couldn’t be more different.
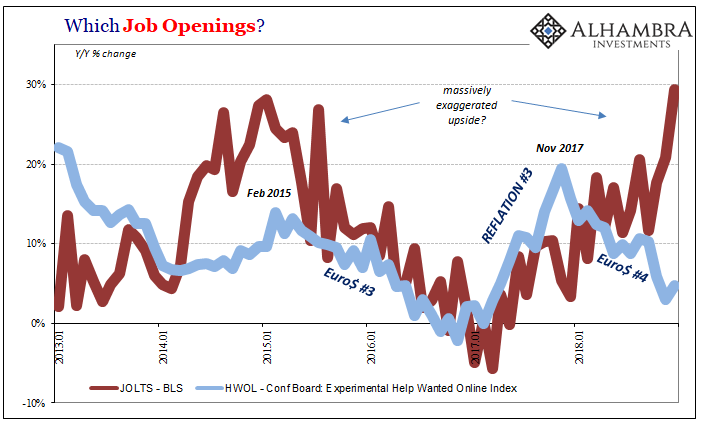
I’ve been arguing since 2014 that the BLS numbers are being artificially accelerated by inappropriate trend-cycle contributions, these far more pronounced during reflation periods. This is, obviously, speculation on my part since I’m not privy to the full data collected and crunched by the BLS (according to widely accepted techniques, I should point out; there is no deviousness or nefariousness). I think this second dichotomy offers more (compelling) evidence to that end.
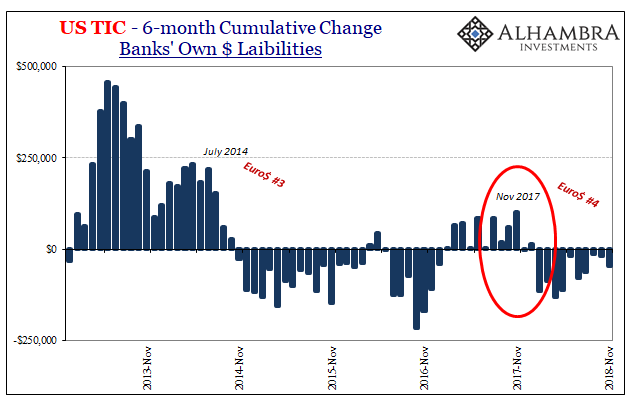
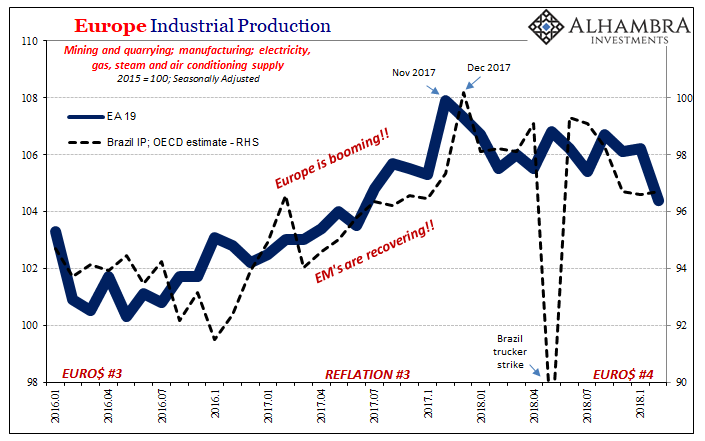
Furthermore, the timing; November 2017 appears as a peak in an awful lot of data all around the world. Those crucial months, December 2017 and January 2018, are corroborated widely as the limits of Reflation #3, in economic accounts as well as demonstrated by the more esoteric eurodollar stuff.
Finally, markets. Is what happened to them this last December consistent with a US boom still booming, JO suggesting maybe even booming better? Or are inverted curves accepting of the HWOL version that the global economic arrow is not just pointing down, it had been pointing down for a year already by then? Sour, not soar.
The BLS gets all the headlines, maybe it shouldn’t. At best the payroll figures are irrelevant. At times, in places like JO, they’ve already proved wildly off-base. It stands to reason at minimum their estimates especially for labor demand should be treated with broad, determined skepticism.
Stay In Touch