
The Treasury Department’s TIC for September 2019 finally arrived yesterday. Two months in arrears, it’s often torturous having to wait for the detailed cross border bank figures to show up for particularly noteworthy months. You might remember September for something going on in repo, and TIC is right where we’ve been tracking (trying to) global repo and collateral flows since the middle of last year.
The TIC data confirms all our suspicions.
To begin with the red side, there had been a growing if convoluted route for unspecified collateral via Foreign Official Institutions (FOI; basically overseas central banks) into the cross border repo channel. It clearly involves the foreign repo pool and you can read about it in detail here. What’s pertinent for the September figures is this:
If, generally speaking, the red is US banks “borrowing” from offshore entities the blue is US banks lending into those same shadows. As I’ve noted several times previously, when in times of funding distress the level of repo (on the blue side that means US bank resales) usually jumps. The repo market, as noted here in TIC as well as in Z1, is the real lender-of-last resort to the global system (because the Fed’s repo operations aren’t really repo operations).
And in September, FOI’s were…very quiet.
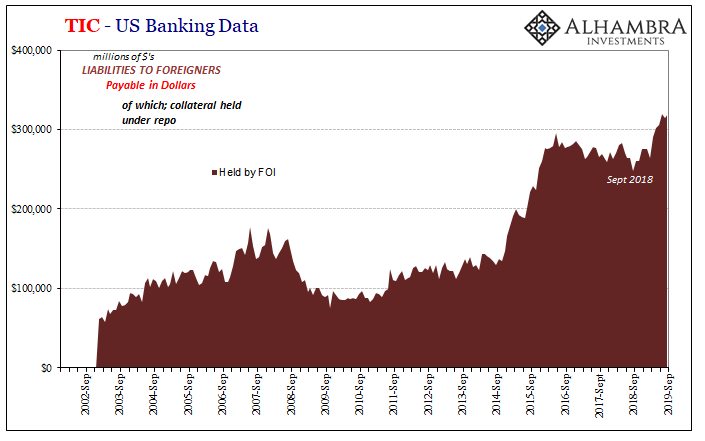
The level of repo collateral owed to FOI’s from US banks dipped slightly in August and rebounded even less in September. Not much going on.
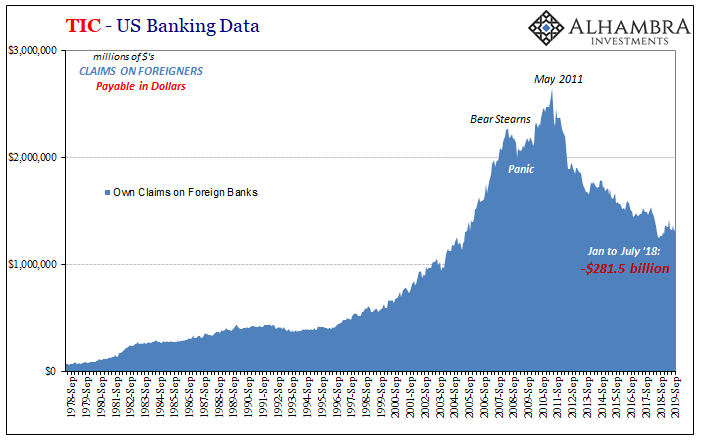
How about over in the blue, the level of resales? You can read more about this crucial piece of the cross-border situation here. The relevant part for September:
Given what we know went on during that period, as well as its consistency with the same pattern over the years, it’s reasonable to infer offshore eurodollar tightness bleeding into demand for domestic resales. Increased cross-border repo would further suggest strong worldwide demand for safe assets particularly since last October.
During the repo rumble back in September this number exploded, right? Nope. All quiet here, too.
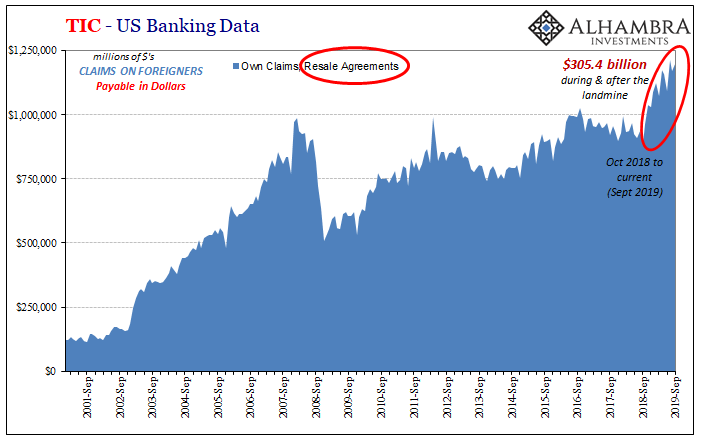
Same as the other; slight dip in August and even smaller rebound in September. It’s as if the repo thing doesn’t show up in TIC at all.
Which is exactly what we’d expect given that the repo rumble wasn’t a “real” event. As I wrote back in September at the end of that peculiar week:
These were further flaws merely exposed by a seasonal bottleneck everyone knew sits right on this part of the calendar. And it still happened. And still the Fed failed to account.
That’s the TIC data: September was nothing big, just a dress rehearsal, and the only reason it happened at all was those “further flaws” which continue to show up as the baseline behind it all. Ever since last year, global dollar conditions aren’t amenable to smooth functioning. That’s the part still visible all across the data.
As it relates to September repo, how unnerving is it that the repo disruption took place on an UPSWING across global dollar markets? Imagine if that dress rehearsal had shown up, say, in early August!
Big difference. Just sayin.https://t.co/XfqzwwqnSh pic.twitter.com/qvAXwbv1UN
— Jeffrey P. Snider (@JeffSnider_AIP) November 19, 2019
While overall the bond market may have been on an upswing, the first since 2018, during September not all was good and well underneath. That’s where TIC can be especially helpful at these times.
For one, foreign governments have been “selling UST’s” as if they are toxic. Many people still are trying to claim it’s because they are worthless, or about to become so, when all market evidence demonstrates pretty conclusively that’s not true. If foreign governments and central banks don’t want them it’s not because they aren’t valued, it is because those overseas entities have their own funding messes to try and get a handle on.
In September as August, the background doesn’t look nearly so good as the backup in global bond yields. The latter is merely the midpoint, the market giving central bankers some small slack to see if they can fix anything (knowing that, balance of probabilities, there’s just too much to fix and too little central banks can do about it).
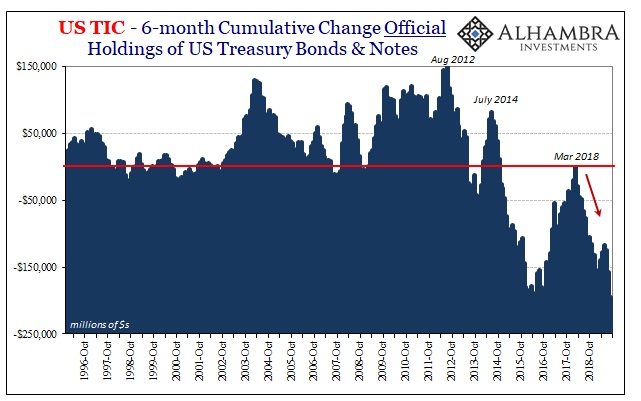
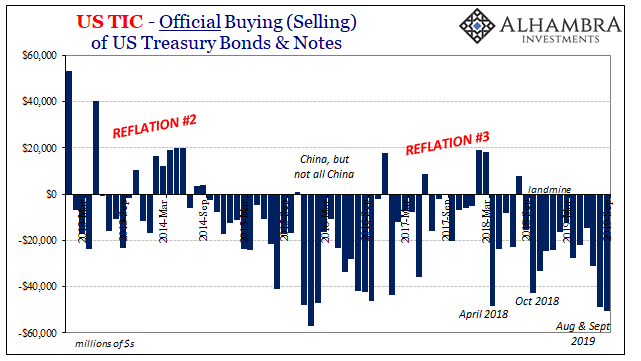
The rate of “selling” over the past two months is more like early 2016 than anything. That’s a bad sign for where things might be heading over the next few months, for maybe the end of the midpoint and what comes after.
And it is confirmed to a certain extent by the reporting banks themselves. While not a big swing, the quarterly total for US$ liabilities was negative again for all of Q3 after posting a slight positive in Q2. More than anything, it is bank liabilities that dictate how everything else is going to go.
That’s simply because this is a credit-based global reserve regime. Not really a currency, but certainly currency-like in that all sorts of liabilities can behave in that way (including repo collateral). Rate of change is what matters; banks expand their balance sheets (collectively), or even just slow the rate of decline, it becomes reflation; contract them and the squeeze is on.
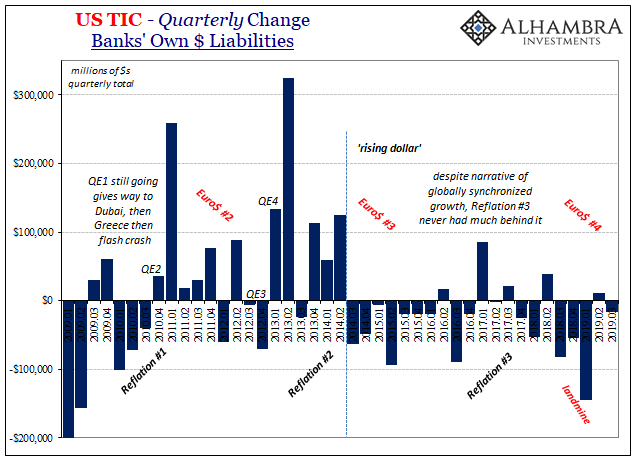
I don’t think there is any better way to demonstrate that point quite like taking the chart above showing quarterly totals for bank liabilities (cross border, in dollars) and plotting DXY over top:
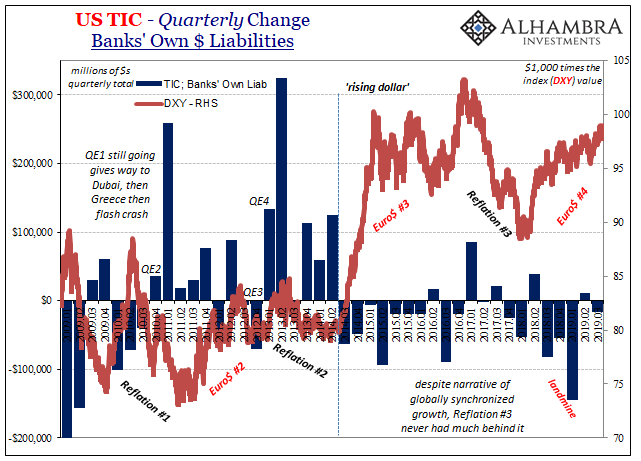
It’s never a one-for-one, of course, in that we don’t expect a linear relationship between bank liabilities and DXY (or anything else). The system is way too complex and opaque for such simplicity.
Thus, what we are really trying to do with TIC as well as other high level data is describe the overall monetary climate into which short run and intermediate-term action takes place. Banks cut back, in general that leads to rising dollar-type stuff across repo, currency markets, bond yields, etc. They stop cutting back maybe even add a little, and it looks like reflation. But because they aren’t really expanding, it can never get past just weak level reflation.
What we see from TIC as well as DXY is how there wasn’t really all that much separating Euro$ #3 from Euro$ #4. The financial media jumped all over “globally synchronized growth” when in eurodollar terms it was so shallow it barely qualified as a minimum interim. The very definition of a molehill where it counted most.
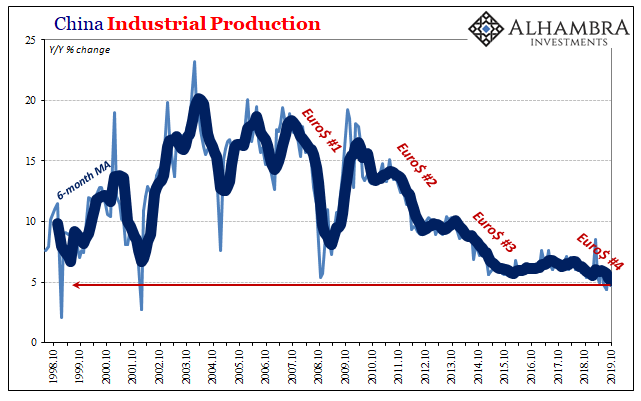
In that way, it matches how China’s economy has evolved going back to around 2013 and 2014; also very little of Reflation #3 in any of its statistics. The two things go together, hand in glove.
The second eurodollar squeeze was it; the 2011 eruption ended all hopes for the global recovery. It took several years, but the lack of really visible global reflation during Reflation #2 following it showed that even China and the emerging market economies once believed invulnerable even in the immediate aftermath of 2008 (Euro$ #1) actually weren’t.
This left open the possibility for the next outbreak to rewrite everything, to permanently redraw global conceptions about risks. Euro$ #3 did that, as you can see very clearly in the TIC bank data and where/how it complements DXY. Without China and the EM’s more broadly, where is there any relatively sheltered opportunity left in the world?
It is a question whose answer both demonstrates the real gravity behind globally synchronized growth, it was sorely needed, at the same time exposing it as little more than a bumper sticker slogan.
It becomes self-fulfilling from there: more risk, fewer dollars, less economy, more risk. Rinse. Repeat. As is happening right now.
Those are the “further flaws” and weaknesses which were exposed during an otherwise unremarkable middle of September week. And the TIC data for September gives us more confirmation for each of those things.
Stay In Touch