
President Trump mentioned the unemployment rate seven times during his third State of the Union address delivered on Tuesday. It was obvious why he did (though I had expected twice that number). His reelection largely stands on where enough people believe the economy stands. He was, after all, elected four years ago to fix what had been a very real economic mess.
Has he fixed it? That’s the question and it is not a partisan issue. The unemployment rate is, however, and it was made one by…Donald Trump. Throughout the 2016 campaign Candidate Trump said over and over again how it was fake. So, outside of the one number, which hasn’t really changed that much in four years, what evidence for having fixed the economy?
Since my election, we have created seven million new jobs — five million more than government experts projected during the previous administration…If we hadn’t reversed the failed economic policies of the previous administration, the world would not now be witnessing this great economic success.
The unemployment rate is at a fifty-year low and beside that over the first three years since he took office seven million jobs were added. Actually, the President can be forgiven for rounding up – the actual total from the BLS was 6.688 million payrolls (Establishment Survey).
Or, that was the total on Tuesday. The annual benchmark revisions have been made and released to the public today. According to the new estimates, the economy managed to gain just 6.334 million 2017 through 2019. It may sound like a lot but it really isn’t. Not even close.
Again, this isn’t a partisan problem; Trump says he fixed the economy and it just doesn’t look that way. Obama had continuously claimed the same thing, just not on Twitter. Bush, well, helicopter money utterly failed. R’s and D’s have this one thing very much in common: no matter what they do (and they’ll tell you that what they are doing is very different from the last guy) it isn’t working.
In both sets of estimates, last year was the worst one for the labor market since 2010. What mostly changed in the revisions was, curiously, just 2018.
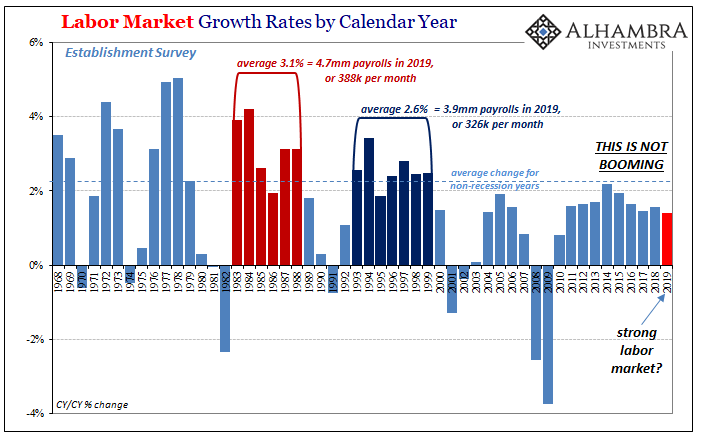
Jay Powell’s big booming labor market has mostly disappeared on him. As usual, the public only finds out so far after the fact no one cares. The Fed Chairman got to strut around “hawkishly” on payroll figures that weren’t real. Instead of labor market growth that stuck out (above) like it might have been the beginning of something big, it is quietly revised a year and a half to two years later as just more of the same lack of growth.
The labor market acceleration in 2018 is today barely noticeable – which, not for nothing, is just what the “bond market” had been pricing that whole time.
As it did the inflection and turn toward serious deceleration. The eurodollar futures curve inverted in June 2018 and now the BLS says the labor market slowed considerably not long after. While Economists and Fed officials were congratulating each other for the economic boom especially around September 2018, the new estimates show how the already globally synchronized downturn had already reached the United States – right in the labor market.
For many in the public, who cares? So, the labor market was significantly worse while Jay Powell was still hiking the federal funds rate and thinking the economy in 2019 was going to need even more. He made up for it with three rate cuts. What would it matter that employment conditions were materially weaker a year ago if they are so much better now?
We have to keep in mind that the Establishment Survey is, perhaps more than GDP, the most smoothed-out economic account imaginable. It was purposefully designed to drown out all the typical statistical noise that comes with measuring economic changes in high frequency data. To drill down to what the BLS believes is the real signal behind the high degree of monthly variations.
But to do that these statisticians have to make several key assumptions. Trend-cycle plays an enormous role here. The Establishment Survey isn’t really measuring monthly changes in payrolls, it is measuring the highly smoothed variation around an assumed underlying trend.
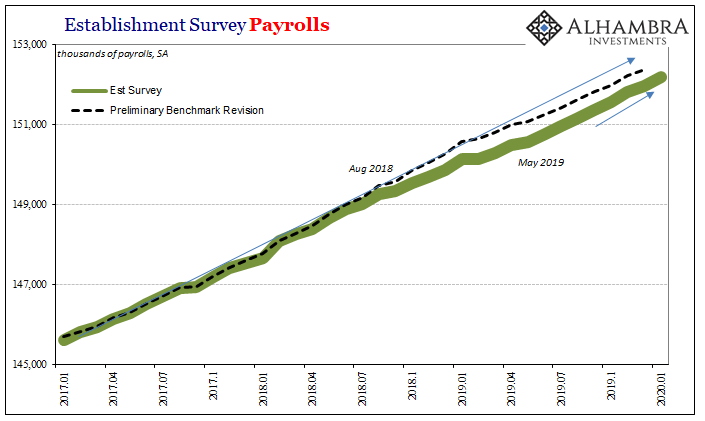
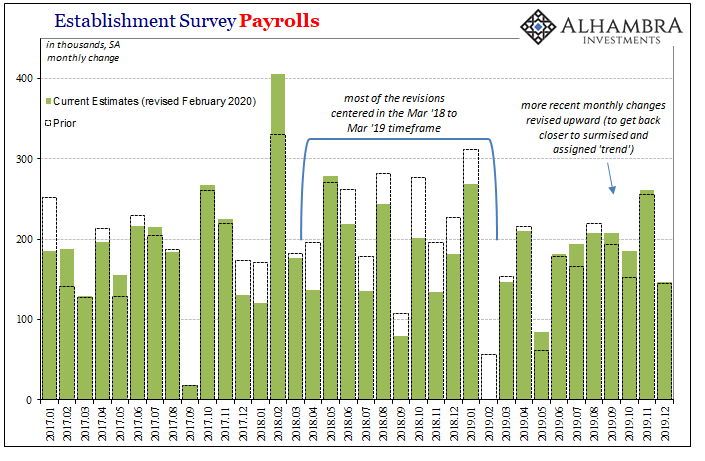
That trend only changes when a cyclical change is determined – recession. What happened in 2018 and early 2019, however, and you can see it above, the BLS had already found out that payroll variations weren’t keeping up with what had been assumed (in the prior benchmarks) as a valid and uninterrupted trend.
By March 2019, they went looking in state unemployment tax filings to check on their assumptions and found out this break was worse than originally thought. Not only had it begun earlier, back around August 2018, it cut far deeper. Half a million payroll gains never happened.
But the one thing it didn’t do was lead to recession (yet). Therefore, the trend largely remains in place for the new benchmark statistical series only adjusted a little bit downward.
If you assume that this serious and undiscovered weakness was just “transitory”, and you likewise and relatedly assume the trend wasn’t impacted all that much, then what has to happen once that weakness ends? The monthly changes must accelerate to “catch back up” to where you keep expecting payrolls to be.
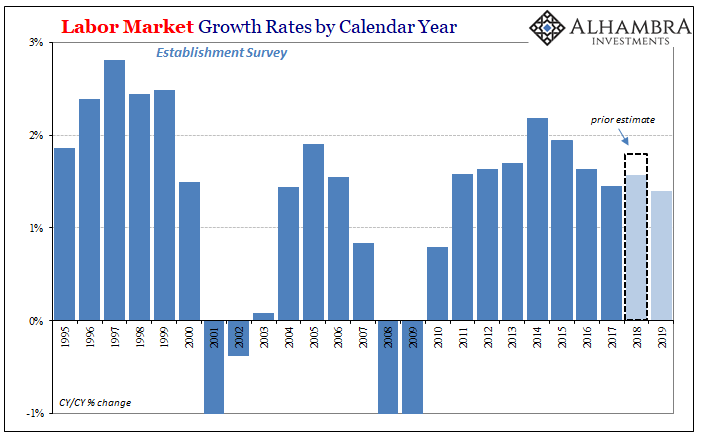
You can see just what I mean by how the 2019 payroll figures overall didn’t change. The year before 2018, was found to be substantially less, but 2019 for the BLS ended up the same way regardless.
Under the previous benchmark, the number of payrolls increased by +1.4% during last year. The new benchmark also finds +1.4%. Under the prior benchmark, the nominal change had been for 2019 +2.108 million. The updated estimate is +2.096 million. A difference of -0.008 million.
In 2018, the difference was -365k, or 13%!!!, and the BLS today admits that more weakness extended into 2019. Somehow that didn’t alter the net change last year one bit? That’s really sticking to trend, and it mathematically requires the acceleration visible in the last half of 2019 in order to manage it.
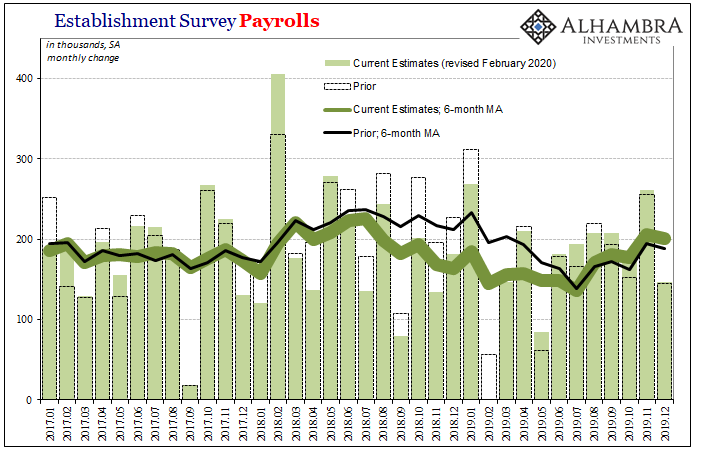
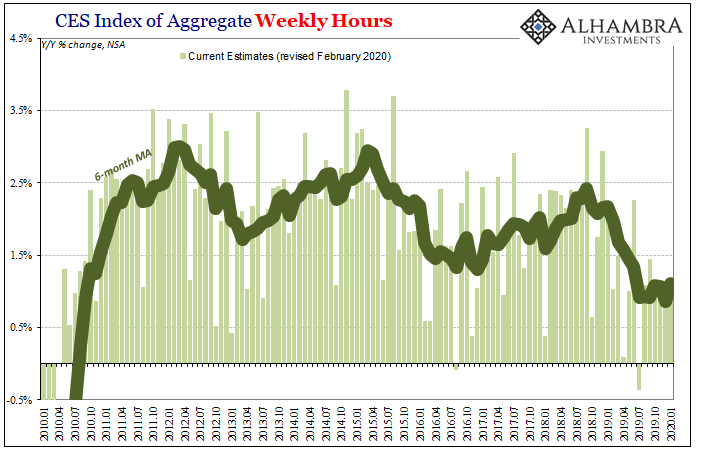
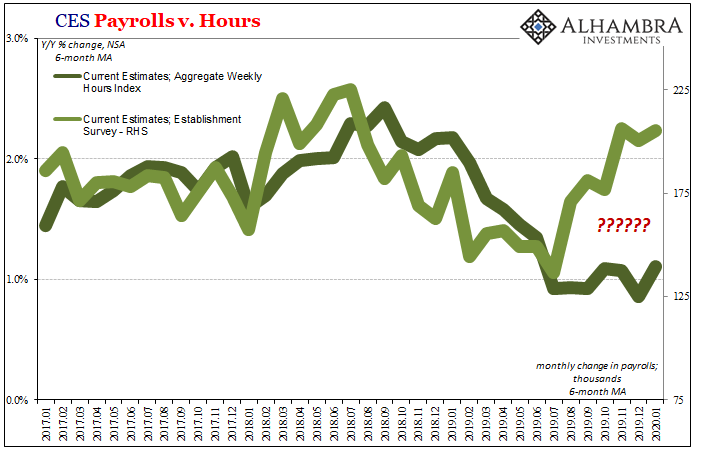
You can also see what I mean in other revised data that isn’t so smoothed and trend-reliant. The BLS’ index for aggregate weekly hours has been one of the primary datapoints pointing toward unusual levels of labor market weakness. This series underwent benchmark revisions, too.
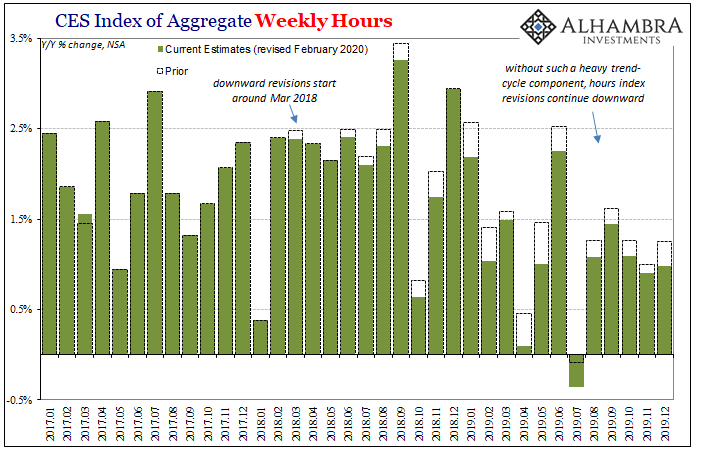
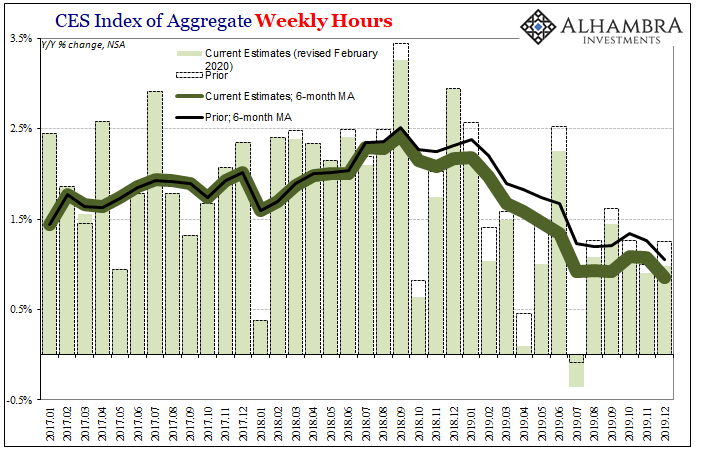
The revisions weren’t as large because they didn’t need to be since the hours index isn’t so heavily manipulated by statistical processes. Still, the same downward revisions coming at largely the same time. Beginning around March 2018 with the changes becoming noticeable by that October.
However, unlike the Establishment Survey the hours index doesn’t have a hard trend to chase in 2019. Therefore, both the downtrend and the downward revisions continued right up until the end.
Rather than this being a year-old issue people have lost interest in or no one cares about, these revisions set up two very different views of how it went in the last half of 2019. The most recent employment condition.
The irony here is that the whole reason the Establishment Survey is considered the gold standard is because it is smoothed out so much. Yet, it may be that devotion which is creating repeated false impressions undermining its entire purpose.
I fully expect that when March 2020 rolls around the BLS will once again go looking at state unemployment tax filings and find out they come up short of the Establishment Survey’s trend yet again. I don’t believe it will be as dramatic as last year’s half a million shortfall, but I do think that trend-cycle is setting the Establishment Survey, and everyone else, up for more disappointment.
And that means it is increasingly unreliable. If it “requires” material revisions year after year, there’s no other word nor category for it. The problem is the assumptions baked into its construction, a hard trend, don’t work as well for this kind of economy.
The one that isn’t booming – but also hasn’t flipped to recession, either.
There’s one last note about the benchmark revisions that goes to the heart of the issue. Whichever benchmarks, February 2019 had been a pretty bad month for the payroll reports. The last set of estimates thought it was somewhere around +50k, +56k as of last month’s data.
The new estimate for February 2019 is +1k. There is absolutely no reason for a +1 to show up anywhere, and it is an infinitesimally small chance it was random, or that’s just the way the numbers went. Statistically, there is no difference at all between a +1 and a -1, or a -10 for that matter.
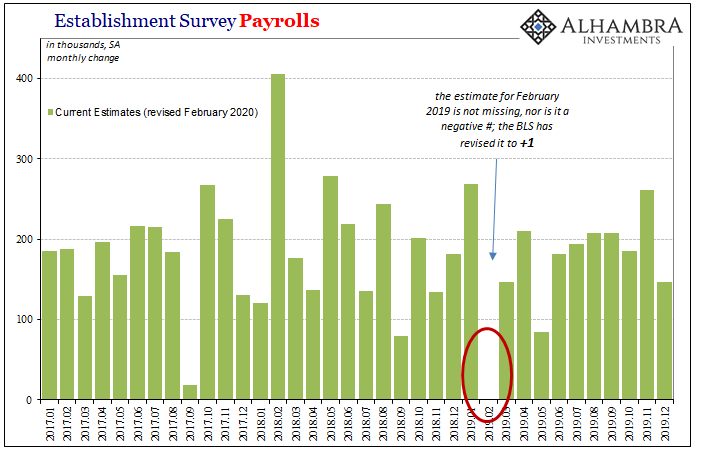
A +1 shows up for only one reason – a placeholder so that a negative month doesn’t break the monthly “growth” streak that is now up to 112. Such a thing, especially showing up a time when the economy was clearly more weakened underneath than because of a hurricane (September 2017) or other non-macro anomaly, a negative for February 2019 would be cause to consider a real trend change.
If you don’t assume one had happened, you also assume a negative number can’t go there.
Two key takeaways from the benchmark revisions: the jobs market was significantly weaker during the year it was supposed to be at its peak. Had it been what the original estimates figured, that might’ve suggested the economy was on the right track toward breaking out of its malaise as the President still indicates (and even then it was questionable, after all, if 2014 didn’t).
Now we know the labor market wasn’t that different even on its way up, and that it has been pushed further downward than previously acknowledged. The economy just cannot have broken out.
The second takeaway is really a question. Where is the labor market going as it begins 2020? The Establishment Survey’s magical rebirth is a little too magical especially considering other data, including revised benchmarks within the same CES suite. The BLS, in my view, is making the same mistakes for 2019 (and to begin 2020) that it made in 2018 leading to inappropriate interpretations of strength and buoyancy that only later were proved invalid.
I’ve written for years these payroll Fridays were largely irrelevant. The revisions to these payLOLs is making my case for me.
Stay In Touch