
From a monetary policy perspective, smooth is what you are aiming for. What central bankers want in this age of expectations management is for a little bit of steady inflation. Why not zero? Because, they decided, policymakers need some margin of error. Since there is no money in monetary policy, it takes time for oblique “stimulus” signals to feed into the psychology of markets and the economy.
Thus, a little steady inflation as insurance against the real evil.
In that sense, the core CPI is perhaps best suited to judge policy success on its own terms. Set aside the oft-emotional objections to the subject, the BLS’s core measure of inflation strips out food and energy prices because history has proved those are moved around often in temporary bursts one way or another. More noise than anything, though painful to most folks.
We need to know what’s truly going on underneath all the attention on oil and beef. Crude prices can and do turn on a dime leaving the rest as it was.
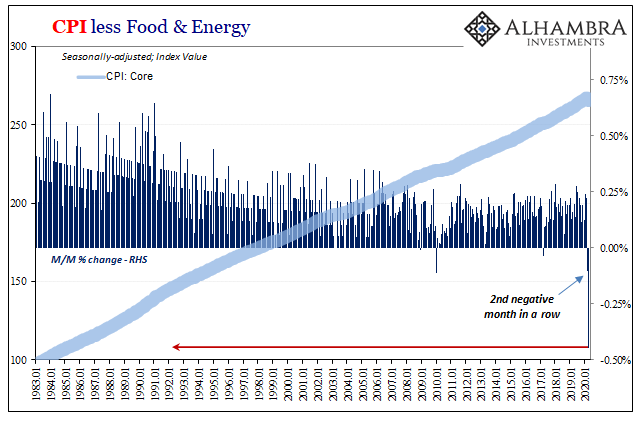
As you might expect, the core CPI, therefore, is very rarely negative. The monthly change in the seasonally adjusted series has been positive in just about every single month. Dating back to 1961, the monthly change has been negative only nine times out of the 711 through April 2020. Since 1982, only five times.
You can probably guess where I’m going.
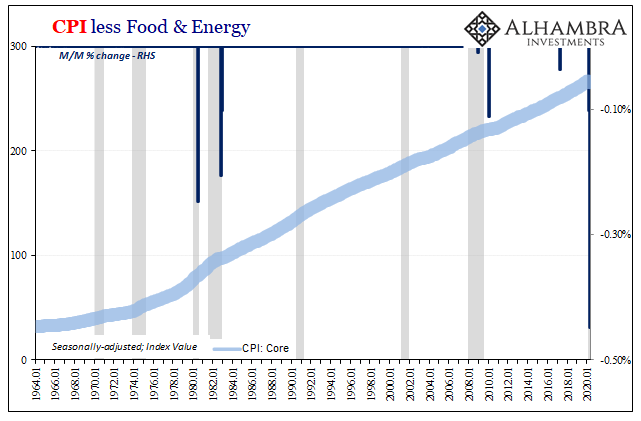
According to the latest estimates from the BLS, core inflation just fell by the most on record. Not only that, this was the second straight monthly decline, accounting now for two of the nine (or five). The last time there was two in a row it was the end of 1982 at the trough of what had been the worst economic contraction before 2008.
As flawed as the CPI is, as unnatural the smoothing of seasonal adjustments, you have to admit the correlation. When economic conditions are at their worst, corroborated by a whole range of unrelated accounts, such is this deflationary calculation (the lone modern exception being Janet Yellen’s 2017 Verizon unlimited wireless melodrama, and even that fits the technical specifications of this topic).
Why is Jay Powell trying so hard? Here’s a big part of that answer. He believes it’s his job to convince economic agents from businesses to market players that this is all just a temporary setback, a big one but nothing longer than maybe a few months. “Stimulus”, he implies, will guarantee it.
Hold on all you suffering consumers and enterprises, the cavalry’s on the way!
What he’s really afraid of is deflation; true deflation of the type showing up above. As I wrote at the beginning of this month, it’s potentially the big one:
This is the classic monetary deflation of scholarship, more above the “deflation” we often speak about in today’s terms. I’m as guilty as anyone, if not more so, of using the term a little too loosely to fit our current age. Commodity price deflation as a result of Euro$ #3, for example, doesn’t really go far enough.
But it could if the resulting economic contraction and scramble for dollars leaves such overcapacity and desperation for liquidity in the business and financial sectors. Once that happens, past some unknowable threshold, true deflation takes hold and it can only end up in the labor market (as Keynes recognized).
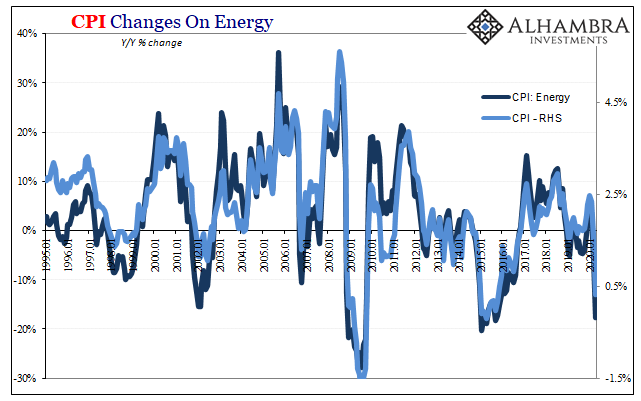
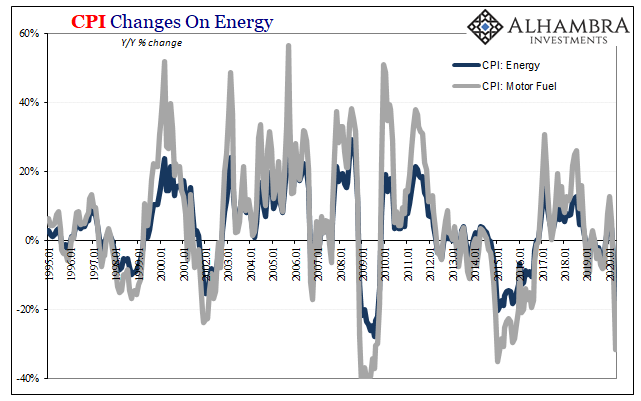
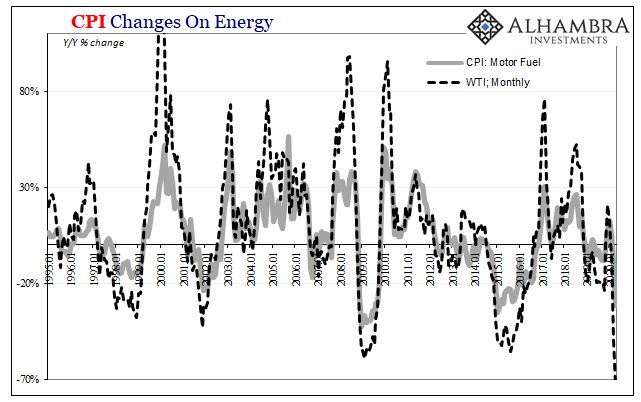
The rest of the CPI report shows what we already know and have expected. Oil prices absolutely collapsed, down by almost 75% year-over-year (average) taking with them gasoline. The CPI’s energy basket, which is driven by motor fuel pricing, fell by more than 17% year-over-year on a 31% decline in pump prices.
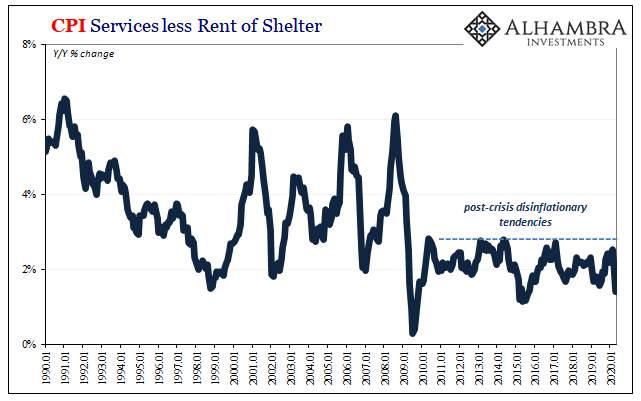
As I wrote in early May, that’s deflationary pressure if stopping short of the full-blown evil. The declines in core CPI values, however, those suggest a wide swath of the business sector (services as well as goods) is being forced to heavily discount product (and then production). The real economy taking it a step further beyond simply commodity pressures.
The latter, a commodity crash, obviously isn’t a good sign for the global economy but so much discounting that it shows up all across the non-energy/food components of the CPI indicates deeper, more dangerous imbalances underneath it all.
And remember, these are April’s figures; more than a month and a half of “money printing” and signals for gross “accommodation” supposedly by the Fed in the books.
What Powell might say in response is that, again, it takes time for his magic to (allegedly) work its way through all the layers of finance and economy. That’s why they had convinced themselves inflation at 2% consistently (the monetary policy target applies to the PCE Deflator rather than the CPI, given the differences in construction it calculates out to about 3% for the latter) was the wise choice, that margin for error. We’re definitely in the error.
But they never achieved it, despite so many inane promises that it was definitely guaranteed to certainly happen in 2018 and 2019. In other words, the lack of success leading up to this year’s massive contraction is a factor, just not in the way it was supposed to play out.
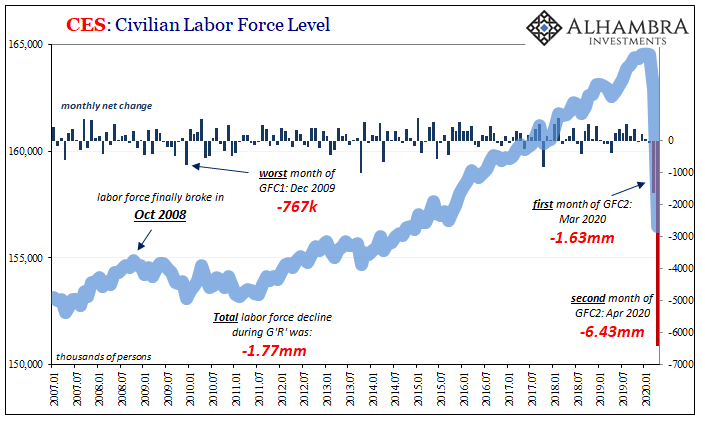
Now the CPI suggests, for the second month in a row, even if monetary policy is effective the business sector may not have time to wait around for some psychological boost. We already know that much from the labor data (as well as clues about that effectiveness).
Like 1982 or even 2009, such deflationary months were, thankfully, few and never sustained. As bad as the Great “Recession” had been, after more than a year of it the global economy found a bottom and lower state of equilibrium anyway.
This, however, is something else altogether – obviously we can’t expect anything at all like the middle eighties to save us. Furthermore, those prior bouts of outright deflation showed up at the end of those specific, nasty contractions.
These have appeared right from the beginning. At the very least, it complicates the situation for what everyone hopes will be a “V” shaped recovery since price discounting like this also takes time to ruin more beyond the initial shape (second and third order negative effects).
There was certainly a “V” beginning in 1983, but we are on the total opposite side of the monetary spectrum. And only an “L” from 2009 forward. Neither of those cut nearly as deep as this one appears to have already. It doesn’t mean the worst case, necessarily, but if you’re holding out for the best possible outcome or even something close to it, Jay Powell’s goal and scenario, these are numbers you just don’t want to see.

Stay In Touch