
The thing about PMI’s is they are all second derivative. The focus on fifty is misleading, beginning with the idea that these things can ever be so precise as to clearly delineate the exact moment between contraction and growth.
When the indices are high, say like 60 or better, that simply means many more respondents are claiming to see increasing levels of activity (or prices, whatever). No word on how much or how fast the increases.
When it gets down to 40 or even 30, the same thing but contraction.
Falling very low, however, you’d have to expect to see an equal and opposite turnaround to identify when conditions are truly getting better.
If, for example, the ISM’s Manufacturing Index dropped all the way to 41.5 one month (April 2020) but then rebounded to 43.1 the next (May 2020), all that means is a small number of respondents have switched their responses. A few more aren’t saying they are seeing lower levels of activity (or prices). Most still are.
What that likely means is the overall contraction is still contracting, just not in quite the same uniform manner. That could mean the beginning of a turnaround, as one might assume, but even if it does this tells us almost nothing about what kind of a rebound it might be.
Since these surveys don’t give us any sense of degree, a few more switching out of the “lower” side might only mean they’ve stopped seeing declines. It doesn’t actually give us any sense of just how high any higher levels might be.
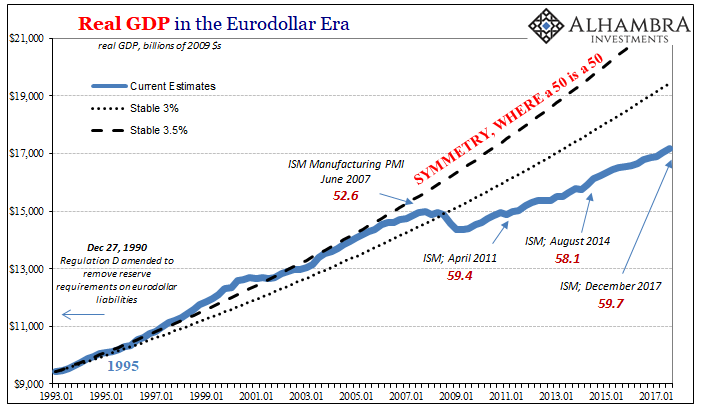
It’s the same problem we’ve encountered before, back in 2017 and 2018 when the ISM, in particular, was through the roof in a way nothing else except the unemployment rate had been. These measures were designed for a symmetric economy, one in which the business cycle recovery actually meant recovery.
The PMI’s didn’t need to ask about degree because in the past it was implicit in the turnaround; once the bottom was reached growth would rapidly return to normal. What if there was a “new normal?”
When the rebound started it had always led to a complete rebound, what we call a recovery. In the aftermath of 2008-09, things were very different. Thus, 2017’s ISM 60 was nothing like what a 60 had been before the Great “Recession.” The earlier represented a majority seeing meaningfully higher levels of activities; the later indicated things weren’t getting worse (at that moment).

Unfortunately, we are a long way from having this discussion again (not that many people took time to think about this a few years ago when the “boom” only had the ISM and the unemployment rate in its corner; both statistics particularly unsuited to these times). In China, the PMI’s just kind of skipped right over the rebound, nestling into pretty much the same level they had left before all this started.
Totally unnatural.
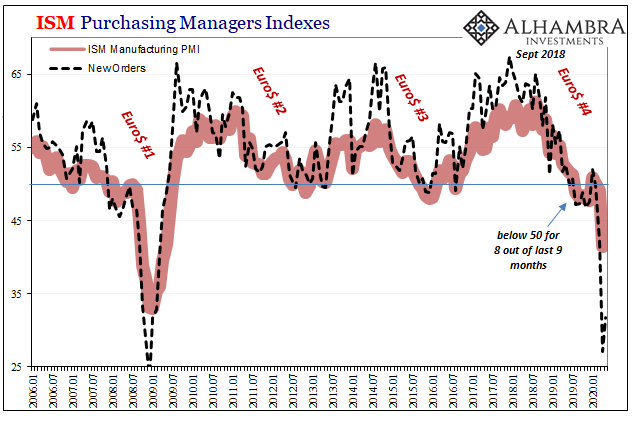
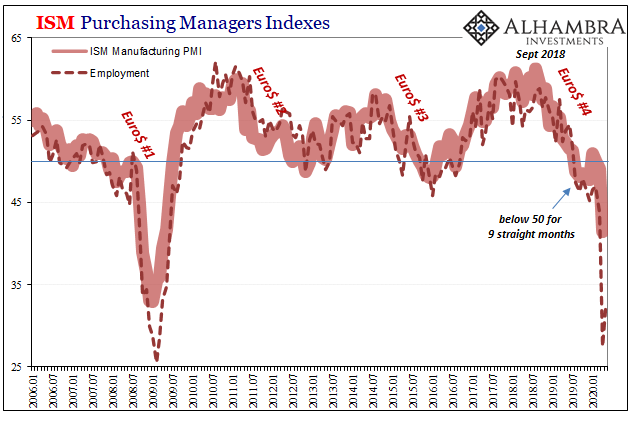
While the headline ISM improved and remained in the low 40s here in America, the improvement was much less for the major subcomponents like employment and new orders, both of which in the low 30s.
April was almost certainly the bottom, but that didn’t necessarily mean May was the start of the “V.” There’s a tremendous difference between getting better, and, like much of the last decade, mere positive numbers associated better with not getting worse.
There is a rebound coming, for sure, but a rebound doesn’t necessarily mean recovery. The difference between and “V” and (another) “L”, in terms of PMI, starts with these second derivatives. The longer it takes to flip a meaningful majority, settle in for the long haul. Even if that does happen, the optimists have all warned you anyway about their scary “V.”

Stay In Touch