
We have to be somewhat careful in making too much out of statistics taken at extreme times like these. Massive moves can trigger unreliable noise in them. The second quarter of 2020 qualifies in every possible way. And the numbers it has produced are certainly extreme.
Late last week, the Bureau of Labor Statistics (BLS) issued its preliminary assessment of labor productivity during last quarter’s interruption. A key component in economic potential, the BLS tries to tease out some idea of it by comparing total hours worked with total private sector output, converting each to a per hour basis.
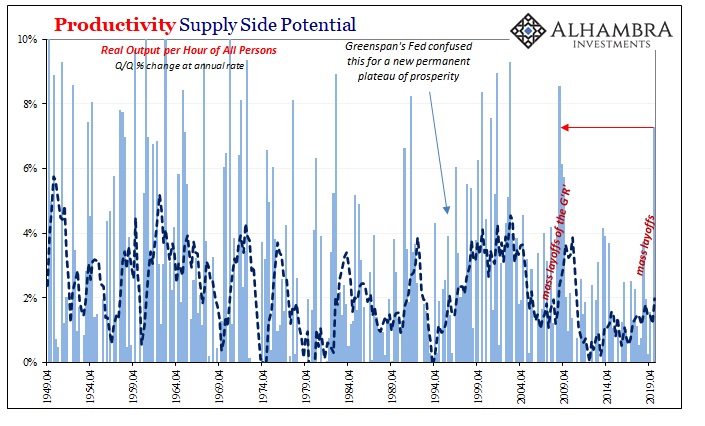
This can give us a sense of how businesses in general are faring underneath the hood, so to speak, and thus an idea of why things are the way they are. In our post-GFC1 world, that has meant unusually low productivity which is rather alarmingly consistent with the lack of growth and recovery from that first time we did this.
“L.”
And now there’s a second to figure out. We all knew that Q2 was bad, so what matters is how quickly we rebound from the overreactions to COVID. Again, keeping in mind that these figures may be wildly revised in the future, but right now there’s some interesting results in them.
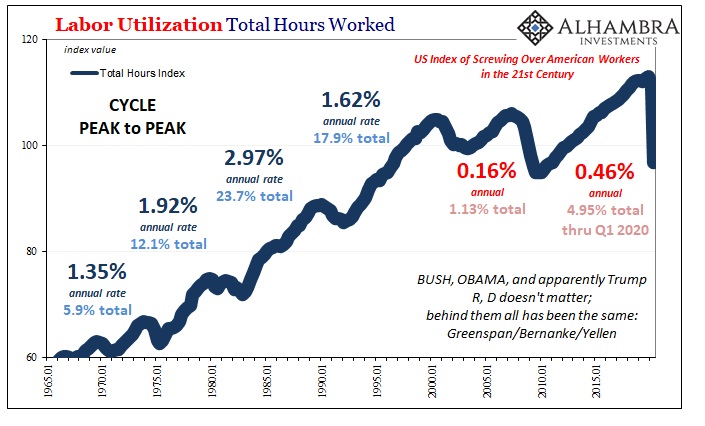
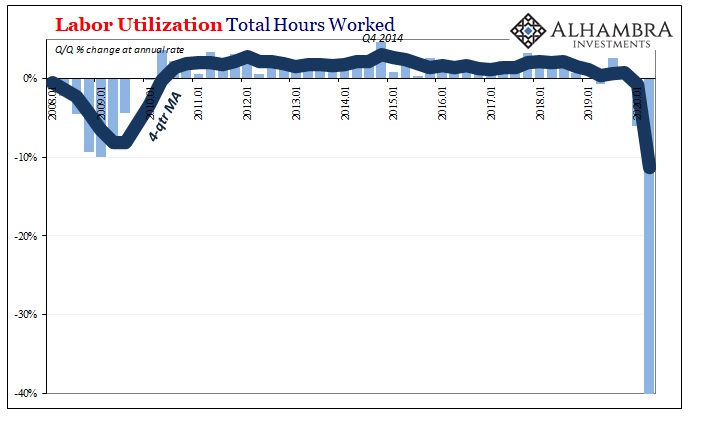
Beginning with hours, obviously Q2 was, by far, the worst we’ve seen in the data series. It’s really not even close. As I wrote back with the release of the last payroll report, there’s been a very concerning incongruity between hours and payrolls, the potential monster lurking in the monster positives:
There’s one final note of caution in the employment details: hours. The rate of decline in them, year-over-year, during July 2020 would have been the second worst had it occurred within the Great “Recession” of 2008-09. What that might suggest is while millions of workers are being brought back onto payrolls, eligible now to begin working again, companies (at least not yet) may not have a lot or anywhere near the same amount of work for them to do.
We’ve been hearing anecdotes and some survey data which indicate that this is indeed the case – those who were initially laid off during the shutdown weeks and months being rehired and taken back off furlough only to be laid off all over again. If so, that’s what happens when you listen to Jay Powell.
Before even getting to July, this divergence between hours and headline payrolls had already suggested that companies may have been holding on to more workers than the decline in output would’ve demanded. In other words, the level of output and actual work performed had declined more than the reduction in headcounts, by a lot more, leaving us to suspect businesses were holding back a sort of reserve of their own workers (who were still on the books but idle nonetheless) having them at-the-ready for when reopening got started.
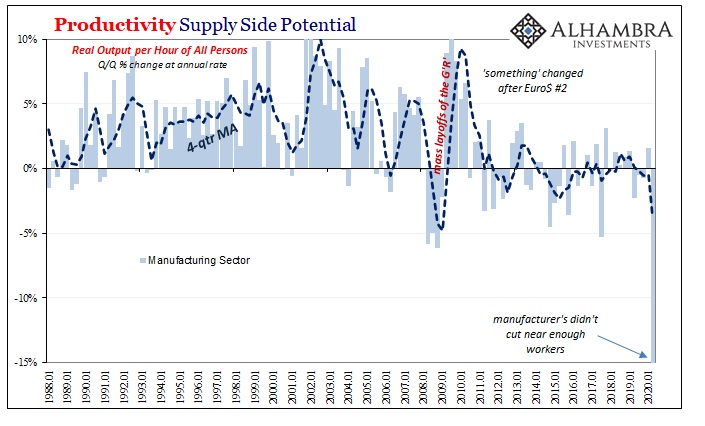
According to the BLS’s productivity figures, this appears to have absolutely been the case in the manufacturing sector; to an extreme.
Productivity declined quarter-over-quarter by an annual rate of 15.5% – by far the worst in modern times. Manufacturers have struggled to begin with, ever since Euro$ #2 (as you can see above), and now faced with a huge dislocation that saw manufacturing output plunge by an ungodly 47% during the quarter they may have “reserved” way too many further workers on their books (as hours collapsed by 37%).
These results are not only consistent with recent “soft” data from the manufacturing sector, they may also help begin to explain them.
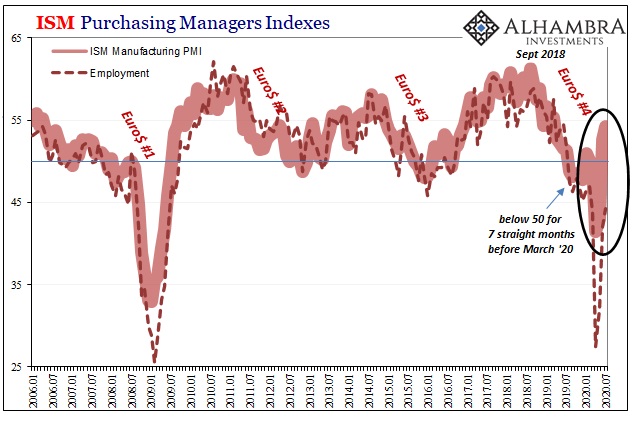
Despite a somewhat bouncier rebound in the ISM Manufacturing PMI, for example, though the headline is not anywhere close to a “V” the employment subindex is even farther away from one. And it proposes that manufacturers were still cutting workers into July – which is what we would expect given these productivity estimates.
In terms of the overall economic picture, it’s one of disappointment and not strictly for industry. While productivity overall for all of private non-farm businesses increased at a 7% annual rate during Q2, given the scale of the disaster that wasn’t exactly “enough” at least when compared to the last time; not even equal to 2009 (meaning, not enough in services to offset the manufacturing).
The economy may have been set up for disappointment by this “reserve” of labor which was likely being held onto by mainstream stoking of expectations for a quick turnaround (great job, Jay). The slowing in the headline employment figures and more importantly the ongoing huge levels of initial jobless claims back up this interpretation.
Things are not going as everyone had hoped. The issue was never about the size of the decline and in the labor market it wasn’t how many workers were laid off and furloughed; it was always about whether or not everyone goes back. And if not everyone, then the conversation changes to degrees of serious, longer term damage (“L”).
What we’re seeing, consistently, is that there’s a very good chance not enough workers were laid off to begin with and as businesses have to adjust their expectations to this disappointing reality that’s going to (further) impede the economy’s ability to get everyone and everything back up and running again.
Worse, it greatly raises the risks of the self-reinforcing, procyclical shoes dropping.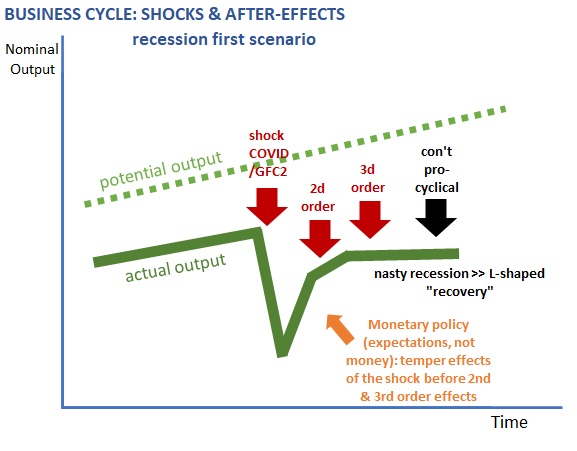
Stay In Touch