
The star of the show once again was the unemployment rate. Since the ratio is a byproduct of the Household Survey, not the Establishment Survey, that means the surprise upside in the other labor survey overshadowed the slowing rate of change in the payroll number everyone usually watches so much more closely.
The headline figure gained +1.37mm payrolls (Est. Survey) in August 2020, though the private sector managed only +1.03mm of them (you’ve no doubt heard about ramping up Census hiring). The pace of the rebound continues to dampen, with or without Census, even as the cumulative payroll deficit from the February peak remains greater than 11.5mm.
The estimate for private payrolls is in line with the one put out by ADP earlier in the week, both suggesting that the labor market may have experienced some kind of inflection several months ago, back in July following the initial burst of reopening.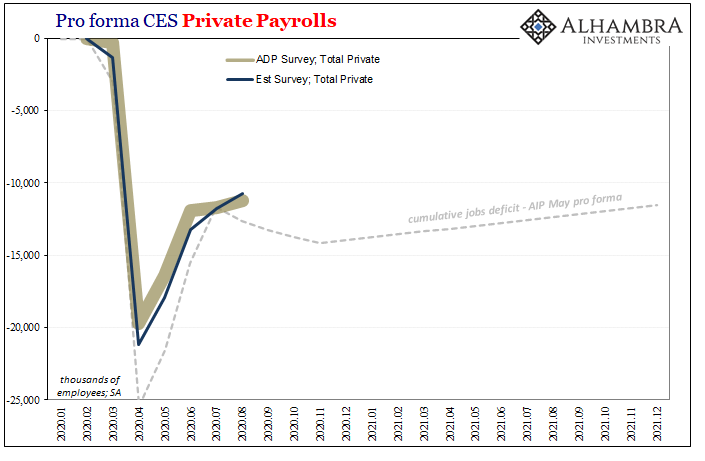
Not many seemed to care, for once, about this Establishment Survey story, preferring instead the far noisier Household Survey. This latter methodology is more unpredictable especially in month-to-month changes, yet this is the basis for the unemployment rate which only recently has received much needed scrutiny (even if by policymakers who continue to draw all the wrong conclusions from that badly needed inspection).
The denominator for it improved, which is to say that the labor force regained nearly 1mm re-entrants last month (still 3.8mm short of its prior peak). On top of the rate, the numerator, the Household Survey blew away expectations by increasing 3.8mm in August.
The net result of those two changes pushed the unemployment rate down by 1.8 points, well underneath double digits to come in at a celebratory 8.4% (given where this all started).
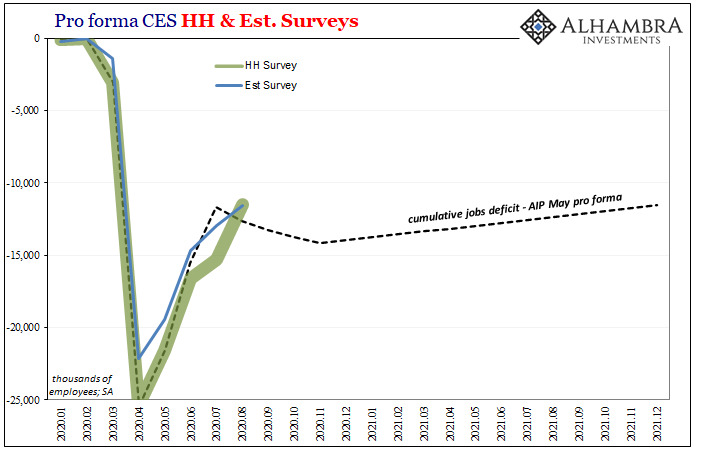
It didn’t matter these changes simply put the two surveys together at what level they now estimate the labor market’s cumulative hole (an astounding -11.5mm). As it had throughout the past few years, the falling unemployment rate has overshadowed everything else in the report.
And that includes, like the past few years, growing questions about that denominator – or just how appropriate the measure might be given these circumstances. For one thing, the cooling down of the private side of the labor market belies the big drop in the unemployment rate.
I don’t just mean the Census hiring; we saw that before in 2010 at a similarly “opportune” time when for a year following the official end of the Great “Recession” payrolls continued to be cut despite “recovery.” The first big rebound in the labor market back then was due to the government (over)hiring for the decennial population count.
This won’t be anywhere close to that intrusive this time around. Instead, it’s still all about what each data figure determines qualifies as unemployment. What we really want to know about is the true picture of strain and distress, all kinds, of which fitting the mainstream definition of being unemployed is obviously the most prominent representation.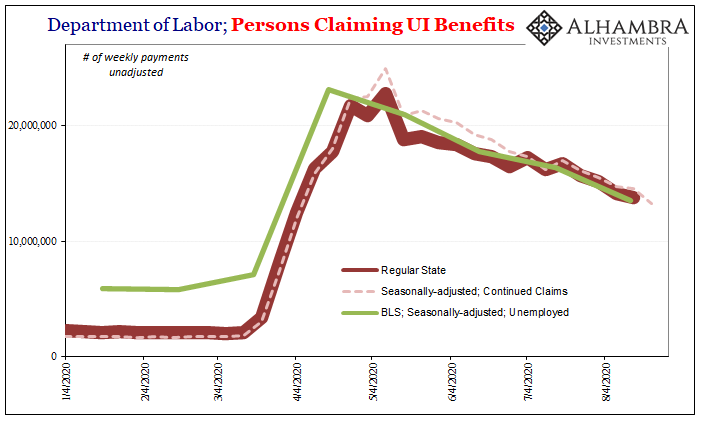
Looking at the various data and the different angles of the unemployment situation they are drawn from, at first glance there seems to be harmony across all of them. The Department of Labor’s weekly estimates for Continued Jobless Claims (seasonally-adjusted) largely in agreement with the monthly number (seasonally-adjusted) of total unemployed produced by the BLS’ Current Employment Situation report.
And those two fit together within the outlines of the unadjusted measure of regular unemployment claims being paid out cumulatively by the various 50 states. So far, the unemployment rate seems to be the product of steady improvement in straight up unemployment.
However, as part of the CARES Act which was signed into law on March 27, there is now a couple other major streams of unemployment claims which are not being covered by the usual claims; nor even by the states themselves.
The federal government has set up distinct and separate assistance to anyone denied eligibility through the regular state plans.
Section 2102 of the Act provides for payment of PUA to “covered individuals”. “Covered individuals” are those individuals not qualified for regular unemployment compensation, extended benefits under state or Federal law, or pandemic emergency unemployment compensation (PEUC), including those who have exhausted all rights to such benefits. “Covered individuals” also include self-employed, individuals seeking part-time employment, individuals lacking sufficient work history, or those otherwise not qualified for regular UC, extended benefits under state or federal law, or PEUC.
PUA, or Pandemic Unemployment Assistance, allows workers to file claims, and receive payments, for a variety of purported COVID-induced labor market harms. These include self-employed individuals who’ve lost income, those who are only seeking part-time work and can no longer find it, others maybe lacking in sufficient work history so as to be unable to collect from a regular state claim, and for other reasons of harm including lost hours that aren’t covered through prior existing means. As well as anyone who has “exhausted all rights” to regular benefits.
So, it’s not necessarily a straight unemployment claim, though there’s obvious a lot of that in them, rather these in total are additional claims of workers suffering some kind of varied levels of labor insufficiency which Washington has declared significant enough to trigger direct intervention leading to unusual aid.
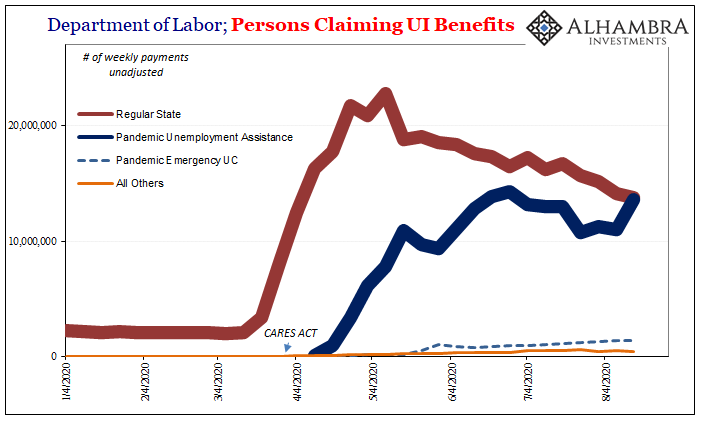
The vast majority of these abnormal filings have been accepted through the PUA described above, though the level of claims via the PEUC is quite substantial, more than 1.4mm at the last update (for the week of August 15), which only looks small presented separately next to the other two (regular and PUA).
When you look at this compared to the overall total (all unadjusted figures), it produces for you a different sense of what might potentially be going on in the whole labor market outside the strict definitions of the BLS unemployment rate denominator. Unusual situations such as these aren’t easily captured by numbers made for usual circumstances (explaining how following the Great “Recession” the unemployment rate fooled all the central bankers).
For one thing, it sure looks like that as many are coming off the regular state rolls a nearly equal number are becoming eligible for, and receiving payments from, the two big direct federal government programs.
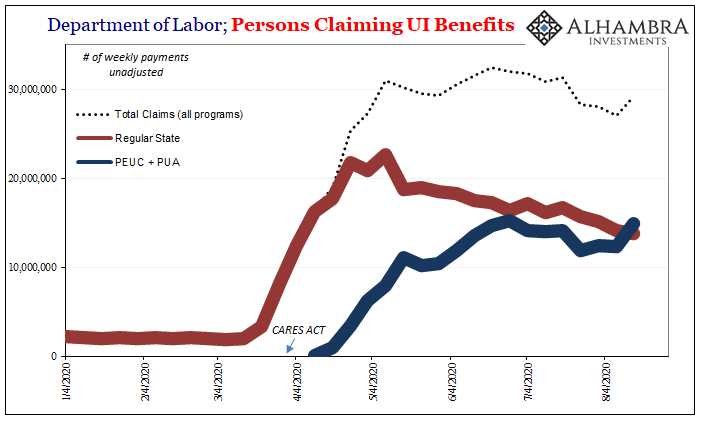
Going all the way back to early May and reopening, the combined number of all types of UI benefits has been more or less steady around 30mm, an unbelievably huge number being maintained week after week, month after month.
In other words, the regular state claims appear to be consistent (as shown before) with the first definition of labor market trouble, straight unemployment, while the PEUC and PUA claims together form a less well-defined picture of no less significant if still non-specific kinds of harm being suffered by what looks to be a rising number of American workers especially since mid-July.
Altogether, like the participation problem for the unemployment rate since the last “great recession”, there does seem to be much more to the story of what’s not going into its denominator.
Why are direct fed program numbers rising after not having improved much at all since June? This would seem to be a corroborating signal, drawn from across very different data sources, the DoL, ADP, as well as the BLS’s Establishment Survey, that despite the unemployment rate’s big August plunge the economic situation behind it on the ground might be something else entirely.
Which is, again, absolutely nothing new.
The problem here is what we’ve stated from the start – that there are, truly, two different labor markets and no real way to sort one from the other. There is the labor market made up of workers who were merely prevented from working by (unnecessary) shutdowns now flooding back to work as those are lifted. Last month’s Household Survey, and to a lesser extent Establishment Survey (lesser still, private employment).
And then there are those who maybe were in that first category but have since found out that they have no job left to go back to (regular state filings) or have been in some other way harmed (lost hours, gigs, self-employment, etc.) by the economic decline in between.
The numbers in the first set was bound to decline sharply (and it really hasn’t) while those in the second, though much more difficult to pin down, it shouldn’t be surprising that the level in this group might still be on its way upward.
Surprising if you blindly follow the unemployment rate. Not even the Federal Reserve is that foolish (anymore).
Stay In Touch