
One of the hardest things to understand as an investor is that markets sometimes – often – don’t line up with economic reality. Markets rarely reflect current economic conditions and at times they seem to discount a future that seems highly unlikely at best, and delusional at worst. That seems to be the case today, as stocks sit near all-time highs and the economic recovery falters in the face of the renewed virus outbreak (or whatever cause you want to assign). But it isn’t just stocks that seem to be discounting a better economic future.
We spend a lot of time watching the bond market as it often seems the wisest of the market crowds. The outlook from bonds has improved recently, although most of the rise in nominal rates is just a reflection of higher inflation expectations. Since November 6th, the 10-year breakeven inflation rate has risen from 1.64% to 1.89%. The change was driven by a rise in nominal rates (15 basis points) and a fall in real yields (10 basis points). The drop in TIPs yields can be read as a drop in real growth expectations, which certainly doesn’t sound like good news, although the market certainly seemed to interpret it that way. The S&P 500 rose 5.4% over the same time frame.
These are not large changes, but inflation expectations have fully recovered from the spring and today are little different than they’ve been since 2014. The larger issue, at least to me, is that real rates remain solidly negative. The 10-year TIPS yield is only slightly above its all-time low and the 5-year TIPS yield is in a similar condition. Real interest rates are an indication of weak investment demand and are inversely correlated with gold prices. Falling real rates make gold an attractive investment alternative, which really tells you all you need to know about how investors view the future.
Other markets are, however, looking more positive, and while we think bond markets are particularly insightful, they are also infected at the moment with price-insensitive buyers, namely this group called the Federal Reserve. So, I’m not very sure that the signal we get from bonds these days is as useful as it has been in the past. I think it is quite important to look at other indicators of growth and inflation to capture how all investors are positioning for the coming end of the pandemic.
When we do that, markets other than bonds are pretty positive about the future economy. The general commodity indexes have risen strongly in recent months. From its low in April, the Goldman Sachs Commodity Index (GSCI) is up 56%. Crude oil is also up from its spring foray into negative territory; how could it not be? More important, I think, is that commodities have rallied strongly over the last month (GSCI, +14%), even as the economic recovery has moderated. The V portion of the recovery is obviously over but markets – people – look ahead and they are increasingly positive about the post-pandemic future. That doesn’t mean they’ll be right of course, but economics is, more than anything, about human behavior, so maybe the markets are making the future rather than just reflecting some misplaced hope about it.
Copper, another widely cited indicator of growth, is also on the rise, up 15.5% just since the beginning of November. More importantly, gold has confirmed the move in growth-oriented commodities like copper. Gold peaked in early August at $2089 and fell 15% to $1767 by the end of November. The copper to gold ratio has risen over 40% from its low and 10-year Treasury yields have risen too, albeit not as much as we might expect. Those are all confirming signals of improving nominal growth expectations.
Having said that, futures market positioning indicates that markets may be getting too far ahead of the real economy. Speculators are increasingly piled into the long commodity trade with large long positions in copper and a host of other growth-oriented commodities, including crude oil. The crude market has been rallying in the face of a contango in pricing, which is generally bearish, but that has been relieved with most of the curve now in backwardation (normal). I also see some extremely bullish positioning in agricultural commodities, particularly soybeans and corn.
On the other hand, other markets where we might expect extremes don’t show them at all. Rising commodity prices are often associated with a falling dollar but large specs are well balanced in the dollar index. I don’t see extremes in the so-called commodity currencies, the C$ and A$ either. There are, however, a lot of longs in the Euro and a fair number in the Yen as well. In the bond complex, speculators are lopsidedly short the long bond, but we don’t see similar extremes in the 10-year Treasury or Eurodollars. Obviously, there are some contradictions here but skepticism is usually warranted when sentiment swings too far in either direction, and market positioning right now is very positive on the reflation trade. It probably makes sense from a risk standpoint to pull back a little and let sentiment come off the boil.
The title of this article is a reference to the Keynesian beauty contest view of markets. If you aren’t familiar with this way of thinking, I’d suggest you read up on it (Here). Investing is not like the lottery where the numbers are what they are and you win or you don’t. Investing is much more like poker where the cards are important but how the other players react is much more so. In investing, the data is important but much more important is how Mr. Market reacts to it.
Our job is to figure out what the crowd is focused on; how the majority views the economy. Markets don’t reflect the economy of today. Markets move based on the majority’s view of how the present will change in the future. An investor’s job is to judge whether that future is realistic, whether the economy can bridge the divide between where we are and where everyone thinks we’re going.
It seems obvious today that markets are looking toward the end of the virus, to what happens to the economy as things normalize. Consensus also seems to be coalescing around the idea that by late spring/early summer the vaccines will have done their job and activity levels will return to normal. Rising inflation expectations make sense if you believe the end of the virus will see pent up demand meet diminished supply. Everyone, it seems, has plans for what they want to do when this is all over. Travel seems to be at the top of everyone’s list, but everyday activities such as eating out or going to a concert will also be in high demand. With airlines shutting down routes and flights and restaurants failing in bunches, you might want to consider making your plans now.
Of course, we have to get from here to there without going broke so virus relief legislation is also top of mind for investors. Aggregate incomes have been maintained so far in the COVID recession and savings have risen. There is ample cash to fund that little post-pandemic boom, at least for now. The biggest risk at this point seems to be a change in the timeline. Can we get to the boom before the next bust?
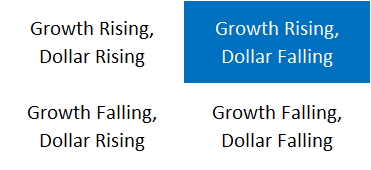
Current Environment
We classify the environment by the trend of the dollar and the economy. Right now, the dollar is in a downtrend and growth is rising. What has changed with the economy is the second derivative – the improvement is continuing but it is decelerating.
Selected Economic Charts
Disposable personal income is up 5.7% over the last year with the help of various government income support programs. Income isn’t the problem:

US Disposable Personal Income data by YCharts
The savings rate hasn’t been this high since the 1970s. Some of that is no doubt precautionary, but some is due to a desire to avoid crowds and forced lockdowns. Regardless of the reason, savings is future investment or consumption so this isn’t a bad thing.

US Personal Saving Rate data by YCharts
The Chicago Fed National Activity Index clearly shows the “V” portion of the recovery fading, but an economy still slightly above trend, at least for now.

Chicago Fed National Activity Index (3 Month Moving Average) data by YCharts
Core capital goods orders are up 5.8% over the last year but orders today are essentially no higher than they were 20 years ago. There is more to investment than capital goods but you might ponder this and consider why Donald Trump’s trade policies were so popular.

US Nondefense Capital Goods Excluding Aircraft New Orders data by YCharts
Consumer sentiment never really recovered from the spring swoon.

US Index of Consumer Sentiment data by YCharts
Click here for the Economic Data Chart.
Market Indicators
10-Year Treasury Yield
Nominal 10year Treasury yields rose through October and November. The trend is positive, nominal growth expectations rising, but the levels are still consistent with weak growth.

10 Year Treasury Rate data by YCharts
Real interest rates are what really matters in the economy and they are moving in the wrong direction. Real rates fell through most of November even as nominal rates rose:

10 Year Treasury Inflation-Indexed Security Rate data by YCharts
Subtract the TIPs yield from the nominal yield and you get inflation expectations and they’ve been on the rise. Nominal rates rising, real rates falling is the definition of stagflation, but I’d expect real rates to start rising as the vaccines get deployed and people start to anticipate further recovery.

10 Year TIPS/Treasury Breakeven Rate data by YCharts
2-Year Treasury Yields
2-year yields have come off their lows but this is just noise. No rate hikes on the horizon:

2 Year Treasury Rate data by YCharts
Yield Curve
The yield curve has finally started to steepen, but for it to reflect anything like full recovery it has a long way to go. There is also the issue, which I’ve discussed before, that the only way for the curve to steepen is for long-term rates to go up or short-term rates to turn negative. As we’ve seen recently rising long-term rates could just be an increase in inflation expectations. And short-term rates turning negative is not an outcome anyone would like.

10-2 Year Treasury Yield Spread data by YCharts
Credit Spreads
High yield spreads fell more than 1% in just November. Spreads are back to the range that prevailed in 2019. They’ve been lower in the past but these levels show no fear on the part of credit investors. Jamie Dimon said recently he wouldn’t touch Treasuries at current prices with a 10-foot pole. I feel the same way about junk bonds. The upside doesn’t come close to compensating for the potential downside.

US High Yield Master II Option-Adjusted Spread data by YCharts
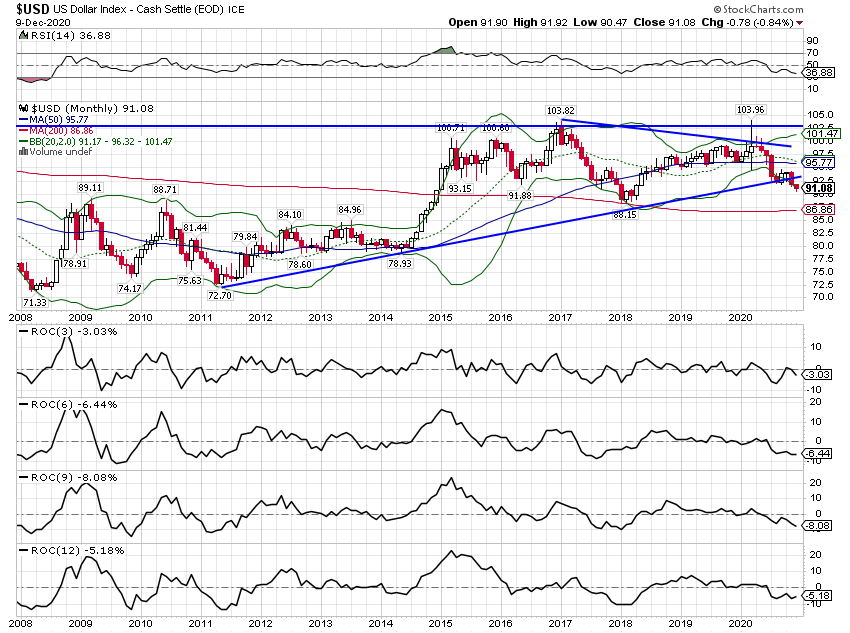
US Dollar
The dollar is still in a downtrend with 3,6,9 and 12-month rates of change all negative. The pace of the drop has moderated a bit though and longer-term measures are starting to stabilize. Sentiment as expressed in numerous articles and Wall Street outlook pieces is quite negative right now. The largest weights in the dollar index are the Euro and Yen and as I said above, speculators are pretty long both of those right now. Currency values are driven by real growth expectations so until you see real rates start to rise I wouldn’t expect much out of the buck.
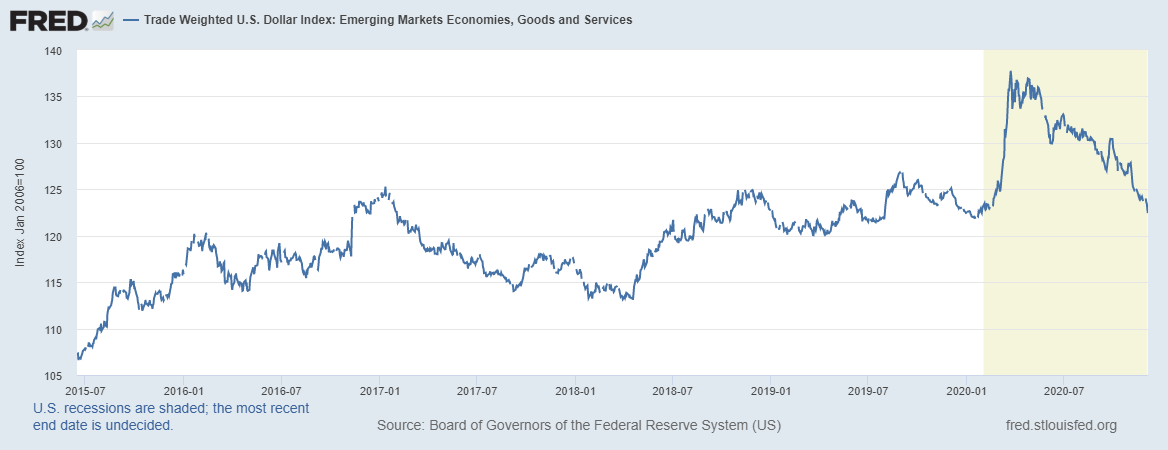
It isn’t just the Euro and Yen that are up against the dollar though. EM currencies have rallied back to where they were pre-COVID. There has been a lot of focus on the Chinese Yuan, with a nearly 16% weighting in the EM dollar index, which is up 8.7% since its worst levels in late May. But the Mexican Peso (13.% weighting) is up too, over 20% since its worst levels in late March. The only EM currency that hasn’t recovered at least some since the spring is the Argentine Peso, which is down 37% YTD. Other losers this year are the Brazilian Real (-25%), Mexican Peso (-6.3%), and the Russian Ruble (-18%). And there are plenty of EM currencies up against the dollar this year including: Chilean Peso (+2.6%), South Korean Won (+5.7%), Chinese Yuan (+6%), Philippine Peso (+5.1%), Taiwan Dollar (+6.1%), and the Israeli Shekel (+5.7%).
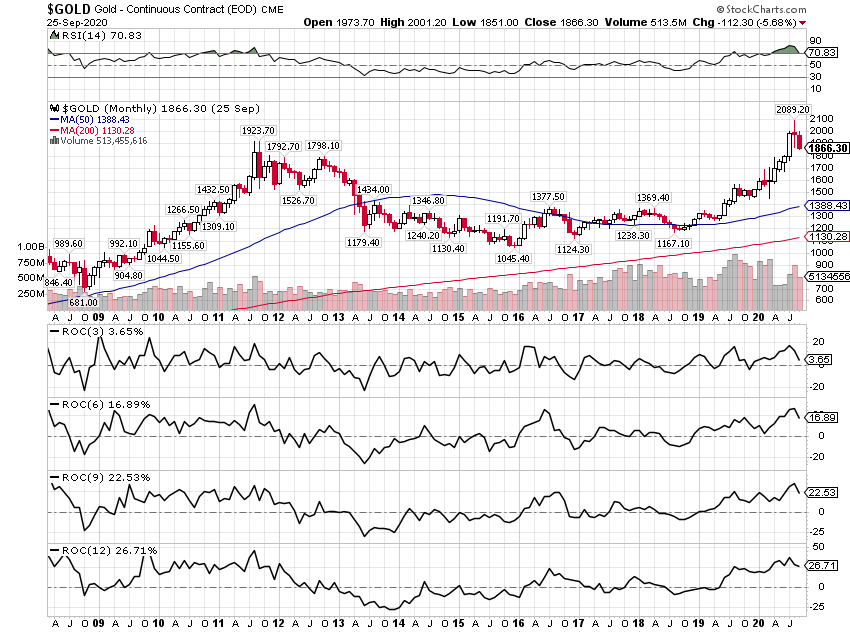
Gold
Gold is still in a bull market but the correction from August continues. I’d now call this a short-term downtrend as the 3-month rate of change is now negative. But the long-term bull market is intact with real rates still in a downtrend.
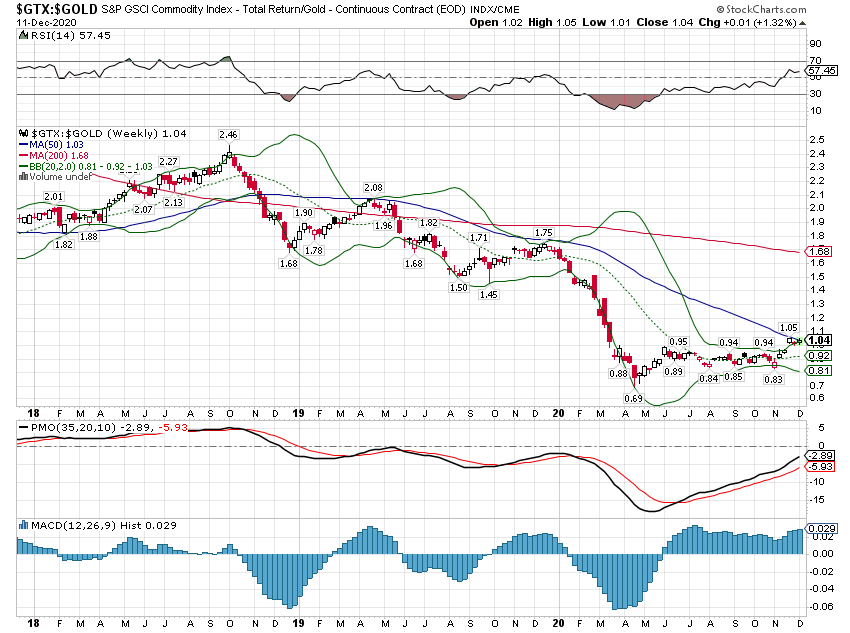
Commodity Indexes
The GSCI has recovered almost to its pre-COVID level and has been particularly strong over the last month. Investors are obviously pretty positive about a recovery in demand.

The GSCI has outperformed gold during the recovery as would be expected. The outperformance has accelerated since the beginning of November, a result of vaccine optimism.
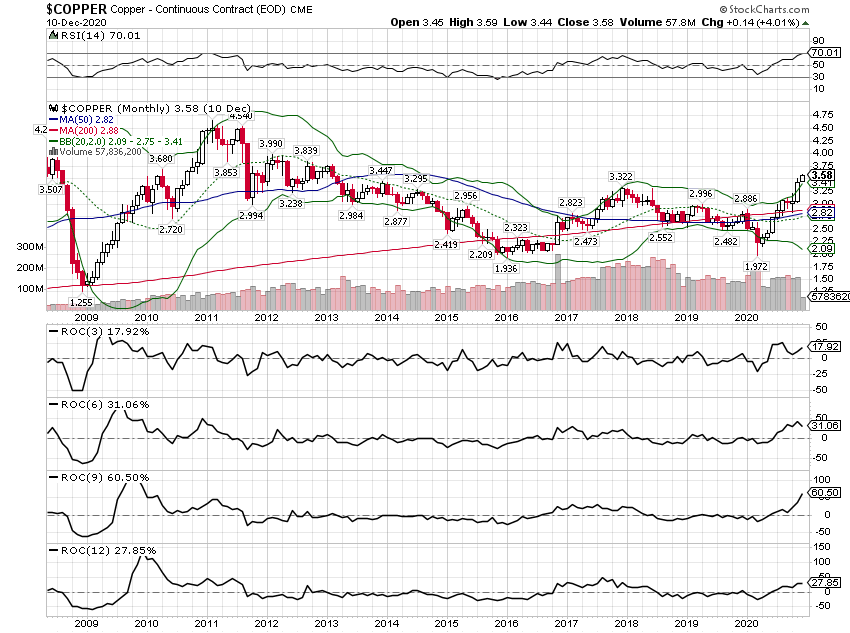
Copper is in a full-fledged bull market with 3,6,9 and 12-month rates of change all positive. Speculators are already quite long so this move may be nearing an end. That doesn’t mean the bull market is over but a correction of some sort would certainly not be a surprise.
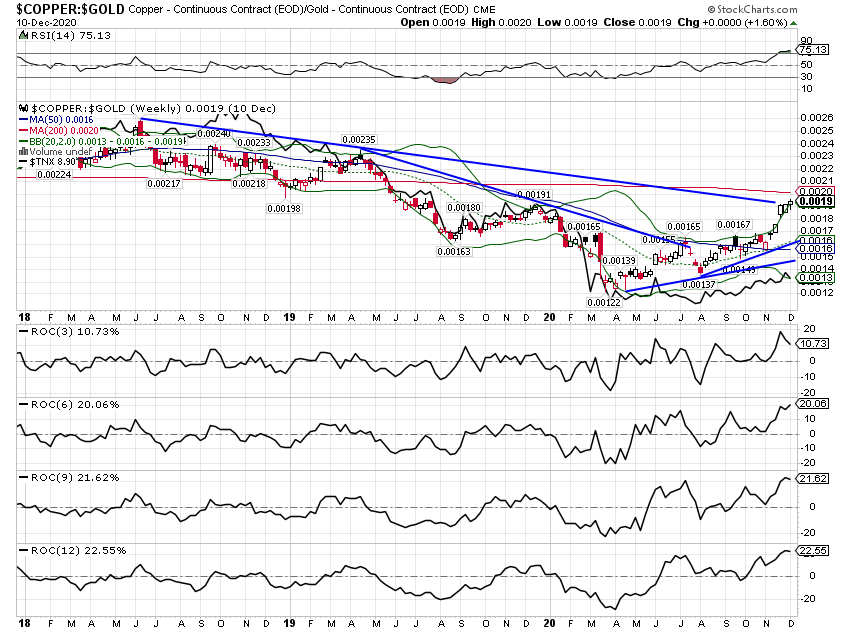
The copper:gold ratio has been rising since the spring but accelerated after August. The 10-year rate (solid black line) has followed but as you can see below, not as much as might be expected. That gap will eventually close, but how that happens is impossible to know. Either growth expectations and the ratio will fall or rates will rise. Or, as is often the case, a little of both.
My last macro economic update was written prior to the election and I’ve been asked frequently since if the outcome changes my views of the economy or markets. The answer is no, but that would be true no matter who won. It is not my job to pontificate about policy or politics. Changes in economic policies happen frequently and investors have to adjust. I don’t know what those policy changes might be (that may well depend on Georgia) and we are not in the political prediction business (thank goodness). Our portfolios are designed, deliberately, to perform in any economic environment. If economic policies change under a new administration that might warrant tactical changes but our strategic framework won’t change.
Markets today seem focused on the end of the COVID era and a return to more normal economic activity. An economic surge to meet pent-up demand as the virus fades would certainly not be a surprise but that will be temporary. As – if – it happens don’t be surprised if markets don’t perform as you might expect. Investors will be looking ahead then too and the long-term outlook for the global economy hasn’t changed that much. If anything, I would expect the debt we’ve added to deal with the virus to be a drag on future growth.
This has been a difficult year for everyone and I’m glad to see it come to an end. My wife and I recently left Miami after 30 years to relocate to my home state of South Carolina. This is a move we’ve been planning for some time but the virus added some urgency. If you have something you want to do, a change you’ve been thinking about, there is no time like the present. There has been a lot of misery in this historic year but there have been some positive changes too. Let’s not let the end of the virus be the end of that positive change. Here’s wishing everyone a Happy Holiday season and a Happy New Year.
Joe Calhoun
Stay In Touch