
It has happened more frequently the past few days. The difference between the equivalent yield for the 6-month (26-week) Treasury bill and its cousin with a 1-year (52-week) maturity has turned negative. You have to watch for it intraday, catching it flipping occasionally back and forth by fractions. After hours more than regular trading.
Inversion, in other words. That dirty term which has plagued the narrative for years on end.
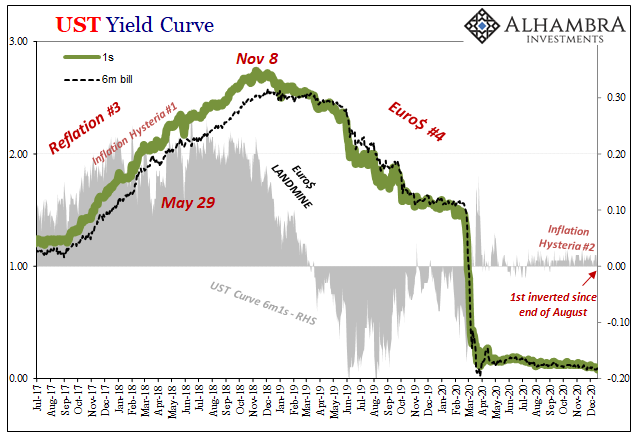
Conditioned to pay attention to only the 3-month/10-year calendar space, or maybe the spread between 2-years and 10, there’s actually been so much more relevant and useful information in other parts. Going back to late 2018 and early 2019, when things were still quite optimistic, Fed “pause” and all that jazz, it was these short bill spaces that more forcefully signaled the other way.
The other way prevailed – and then some. The 2s10s, for example, wouldn’t get so low, wouldn’t signal what bills already had, for many months further into last year.
Even in late 2019. Similar situation to today, the Fed doing not-QE and “repo” operations, supposedly “printing” excess “money” by doing so which along with three rate cuts were, “they” said, putting the global economy back on course to inflationary acceleration. The bills, as I noted in January, before GFC2 and COVID, weren’t situating this key part of the yield curve that way.
Inverted here, too:
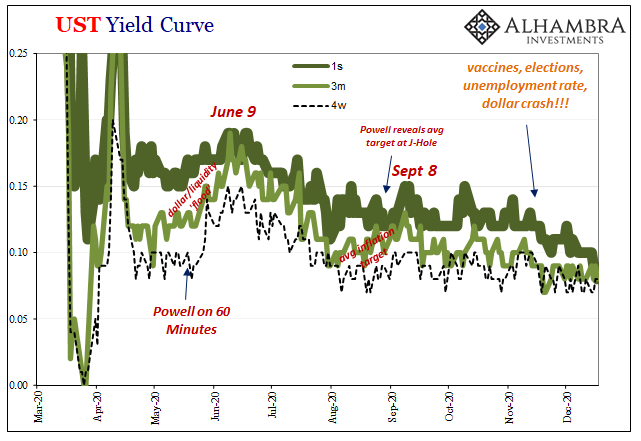
That “wrinkle” importantly between the 6-month bill and the 1-year (below) re-emerged and has been alarmingly steady since early November [2019]. A forward-looking part of the market thinking about the realistic possibility of more rate cuts over the intermediate term ahead and doing so well before anyone had heard a thing about Chinese coronaviruses.
Once more, yep. Not just rate cuts, though, Jay Powell making bills scarce via his desire to put the “not” in not-QE as if there’d been a material difference. The result was making things so much worse when the time came.
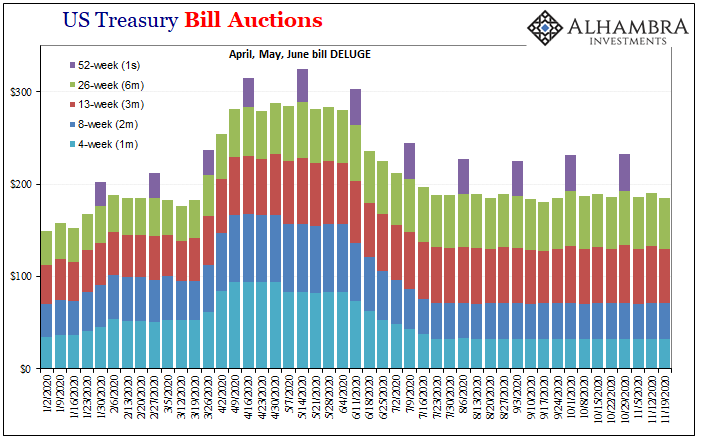
Nowadays, the Fed stays out of bills but Treasury supply churns the usable market supply in the same way. Fewer bills late in this year, too.
The 1-year has even flipped underneath the 2-month (8-week). That also had happened back in March 2019 before also coming back up last November.
The last time this year there had been a single bip inversion in these bill spaces it was the end of August – Jay Powell’s fiasco and then what followed was that two-and-a-half-month period where everything from stocks to oil (and dollar) reset themselves as skeptical. Not complete risk-off, but nowhere like risk-on. Not even inflation hysteria.
It’s only a few here or there, but that’s all it might be at times. A little bit of unusual to indicate imbalance. In the yield curve, deepest market in the world, imbalance where there really shouldn’t be any unless there’s something to it.
Especially periods like now when everything is supposedly going the right way, inflation just on the horizon, yet there are so many other contrary associations not necessarily limited to bills. Collateral always being a huge part, this is a good place to start. Always keep a wary eye on bills.
Stay In Touch