Note: There are a lot of charts in this post. That doesn’t mean that we are technicians. We use charts because we are primarily interested in trends, especially long-term, big-picture trends. And charts are the easiest way to present that information. In general, you will want your tactical adjustments to respect the long-term trend. There are times when it makes sense to position for a reversal but only at extremes.
Stocks
S&P 500
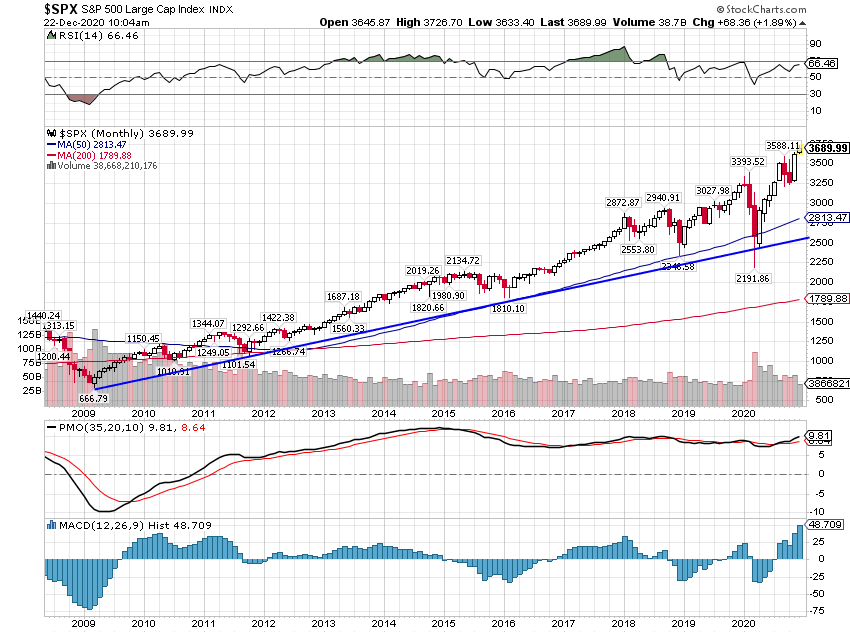
The trend here is pretty obvious, although there was certainly reason to think it might be changing back in March. A couple of things to notice here. Volatility has increased considerably since 2018 and that can be seen as a loss of momentum. Or maybe a loss of the consistency that prevailed from 2012 to 2018. Another observation is that the current price is well above the 50-month moving average. A moving average is just a way to smooth out the ups and downs, a representation of the long-term trend. This is one of those extremes where it is starting to make sense to look for a reversal. A fall to that rising 50-month average is a little over 20%. Not necessarily a bear market but painful nonetheless. And that will happen at some point. With sentiment so bullish, the contrarian in me thinks it could be soon but there is no way to predict the timing. And no, I have no clue what might trigger such an event. Neither does anyone else. As a famous seer once said, “impossible to see the future is” (Yeah, I’m a big ol’ nerd.). We are currently underweight the S&P 500 on a tactical basis.
Growth vs Value
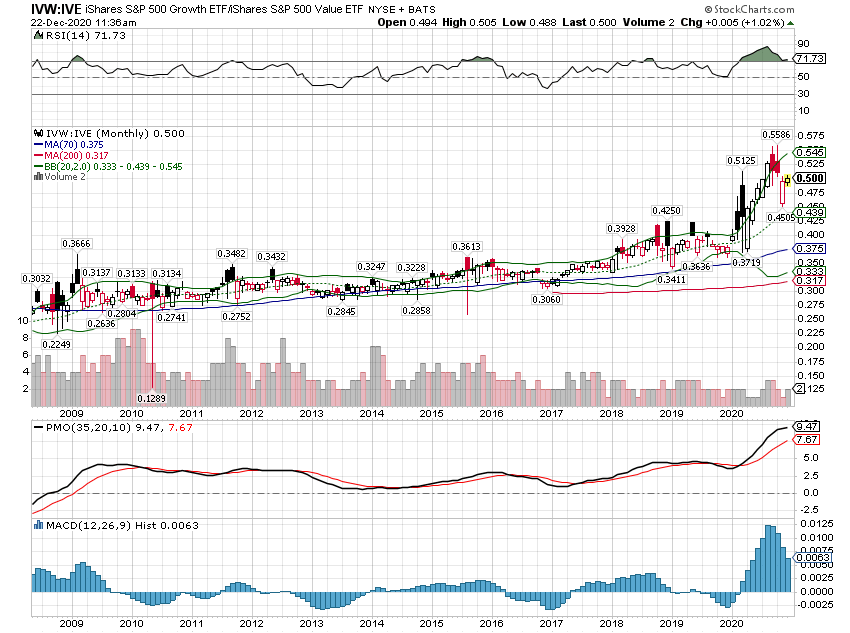
This bull market has been led by growth stocks, which is what we would expect from a strong dollar environment. This is a ratio chart of the S&P 500 growth ETF (IVW) versus the S&P 500 value ETF (IVE). A rising ratio means growth is outperforming value.
The outperformance of growth started to accelerate in 2014/15 when the dollar surged higher.
IVW Total Return Level data by YCharts
The surge in growth stocks relative to value during the virus has been extreme:
IVW Total Return Level data by YCharts
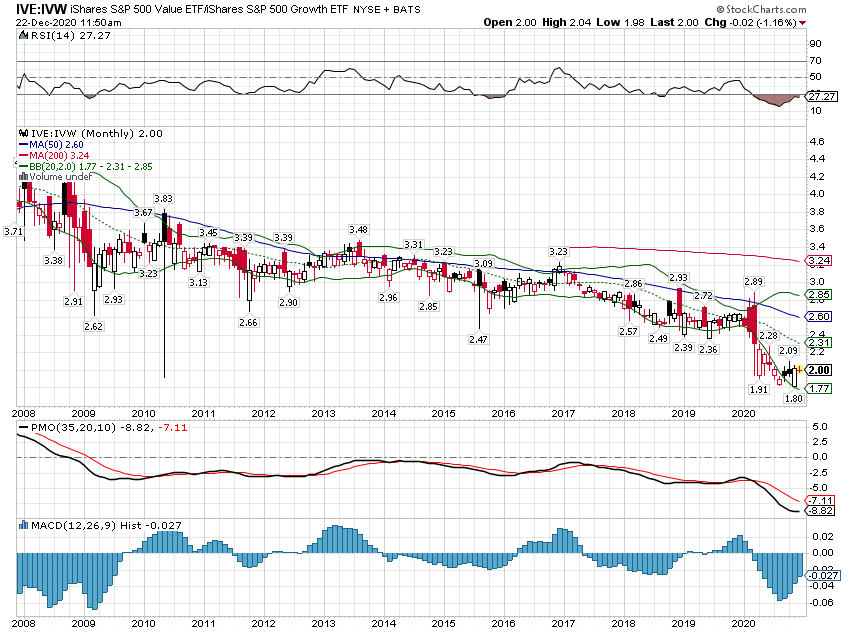
This is another trend that has reached an extreme and seems likely to reverse at least back to the previous trend slope. If we look at it from the viewpoint of value (IVE:IVW), it is easier to see the potential rebound. Moving back up to the previous trend would require erasing growth’s outperformance of this year. I am pretty confident that will happen but don’t know how. Value could mark time while growth falls 30%. Or value could rise while growth marks time. Or, most likely, some of both. Whether the long term actually changes to favor value is not a question that even needs to be asked yet. We are currently overweight value versus growth to capture the rebound.
Large vs Small
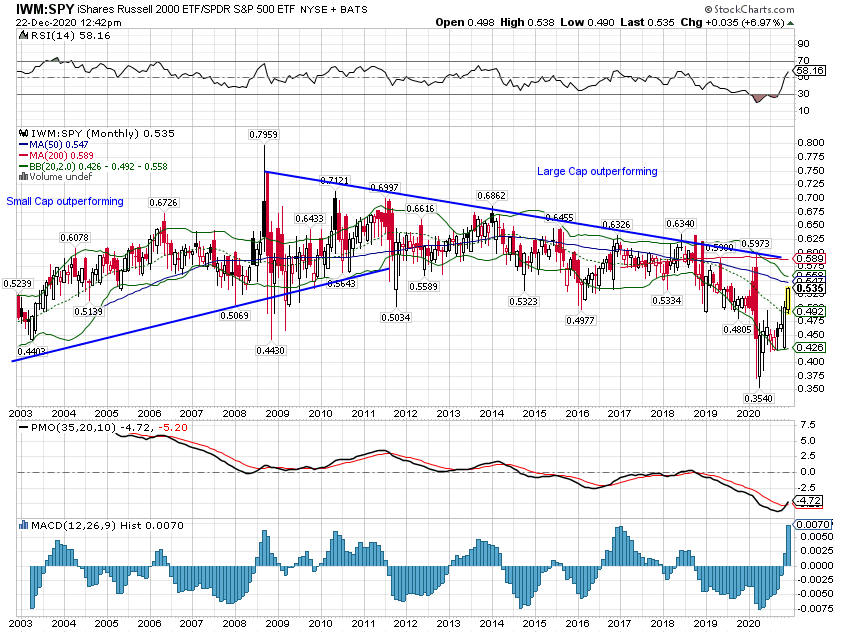
Large-company stocks have also outperformed small-company stocks this cycle. Again, that is what one would expect in a strong dollar environment. It is also a trend that reached an extreme in the summer and is now rapidly reversing. Like value vs growth, whether the long-term trend changes isn’t even worth asking yet. That will be determined over a longer period of time and likely depends on the dollar trend. We raised our allocation to small-cap in the summer and are still overweight.
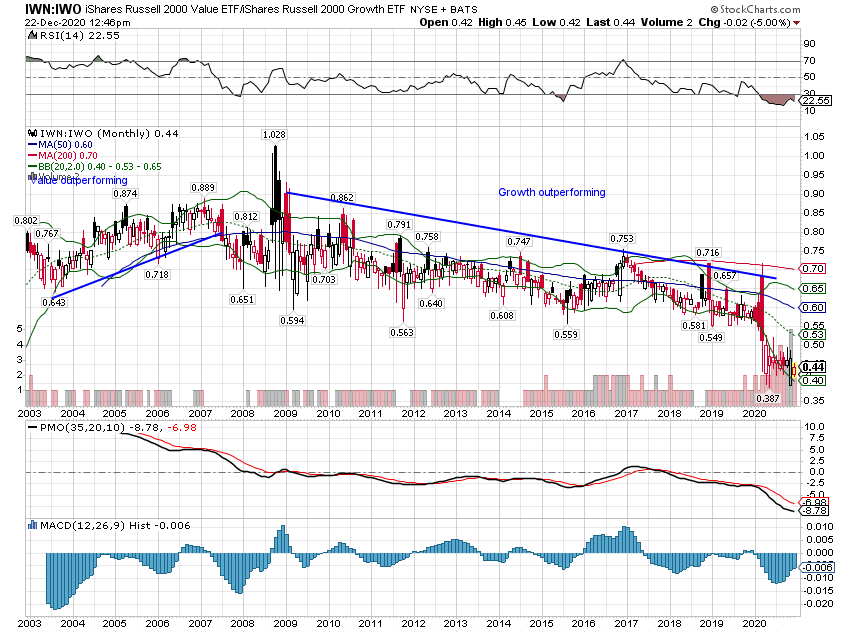
The value vs growth drama has played out the same in small-cap as it has in large-cap. We are overweight small-cap value right now but the gap remains wide.
US vs International
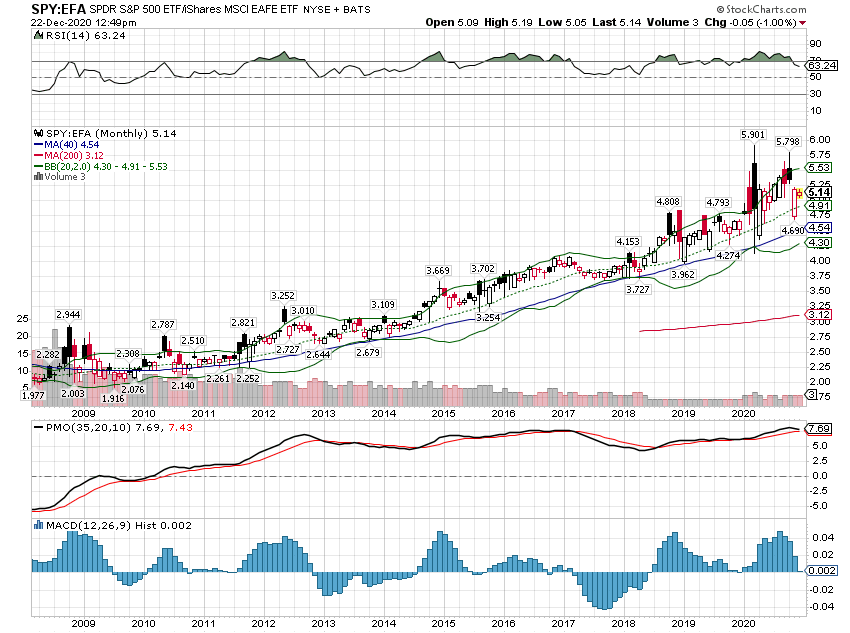
Another trend that favors the S&P 500 is versus international stocks. The trend is obvious and persistent whether measured against developed markets…
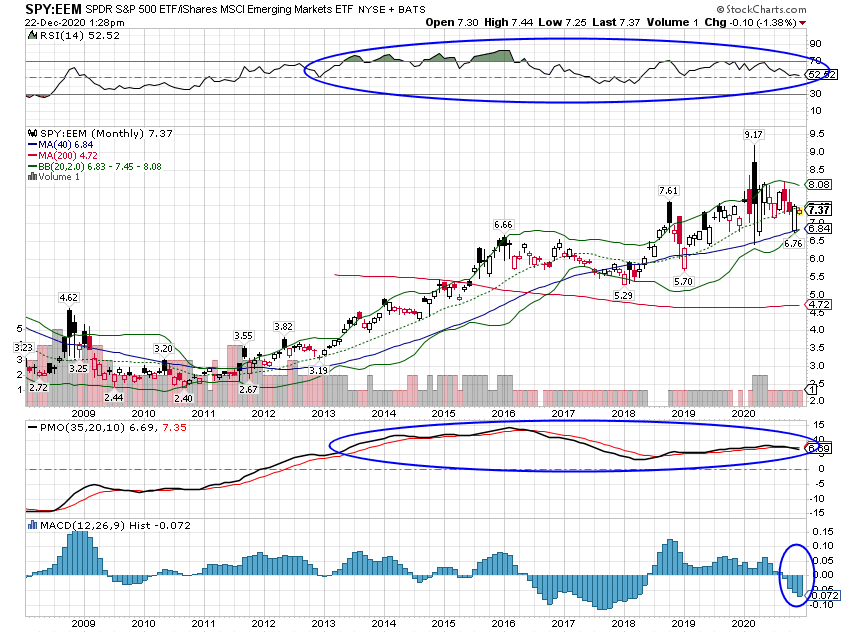
…or emerging. However, something interesting is happening with EM stocks vs S&P 500. Long-term momentum is starting to shift. The recent peak of the ratio produced a new high in price but not in momentum (see circled areas).
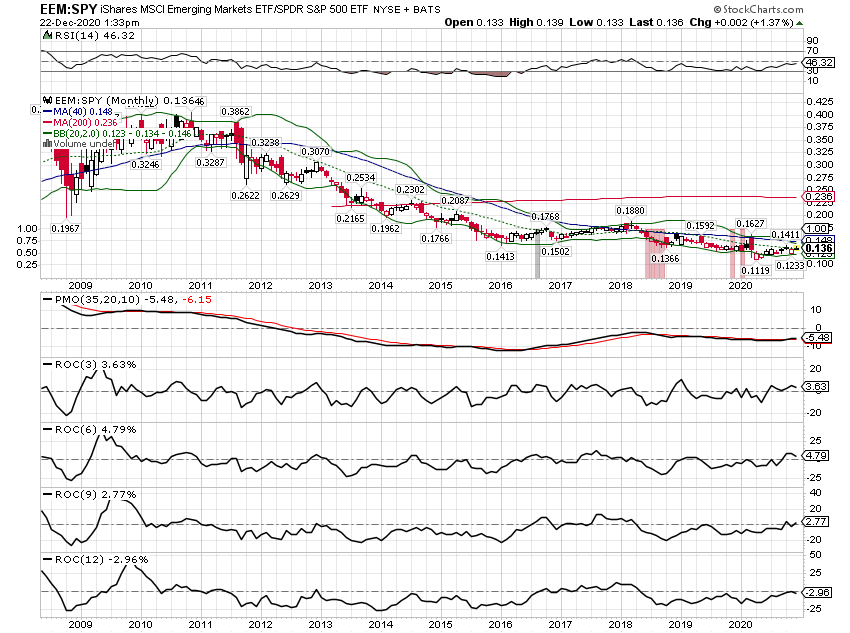
Viewed from the perspective of EM (EEM:SPY), the 3, 6, and 9-month rates of change are now positive, favoring EM over S&P 500. The same measurement for EAFE vs S&P 500 only shows the 3-month change positive. We have been monitoring these rates of change for a long-term trend change as the dollar has weakened. We are long EM now but only a fairly small position. We need to see more dollar weakness to get more aggressive. It is also still possible that the dollar rallies and this short-term trend turns out to be exactly that – short term. This position is counter to the long-term trend and therefore more tentative.
Real Estate
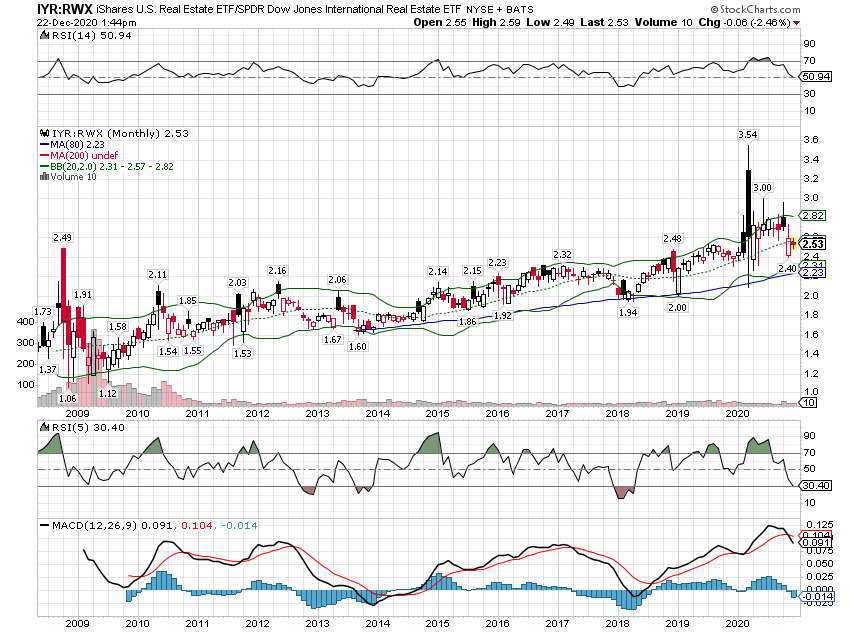
Like other domestic assets, US real estate has outperformed international:
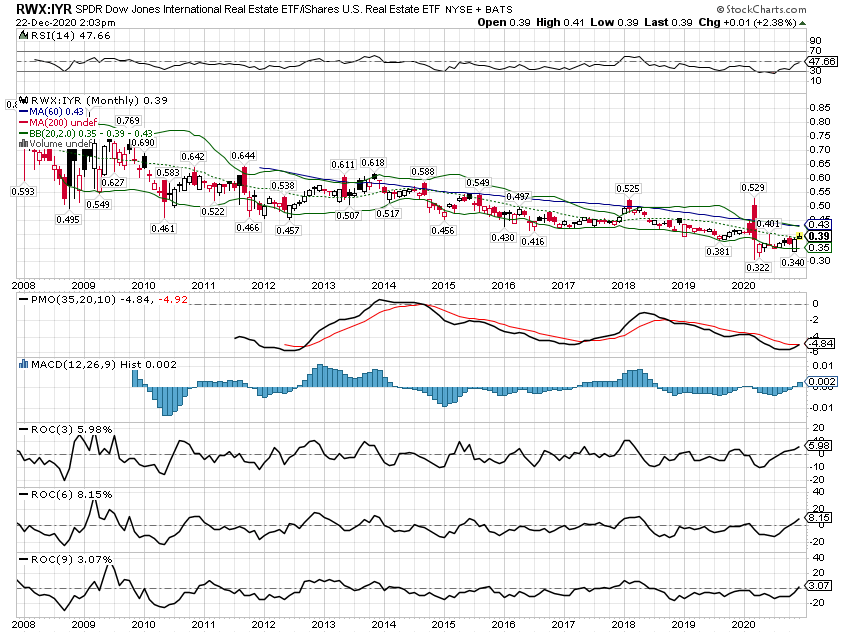
However, like EM stocks, international real estate momentum appears to be turning. It is still a countertrend move but the 3, 6, and 9-month rate of change is positive, favoring RWX over IYR:
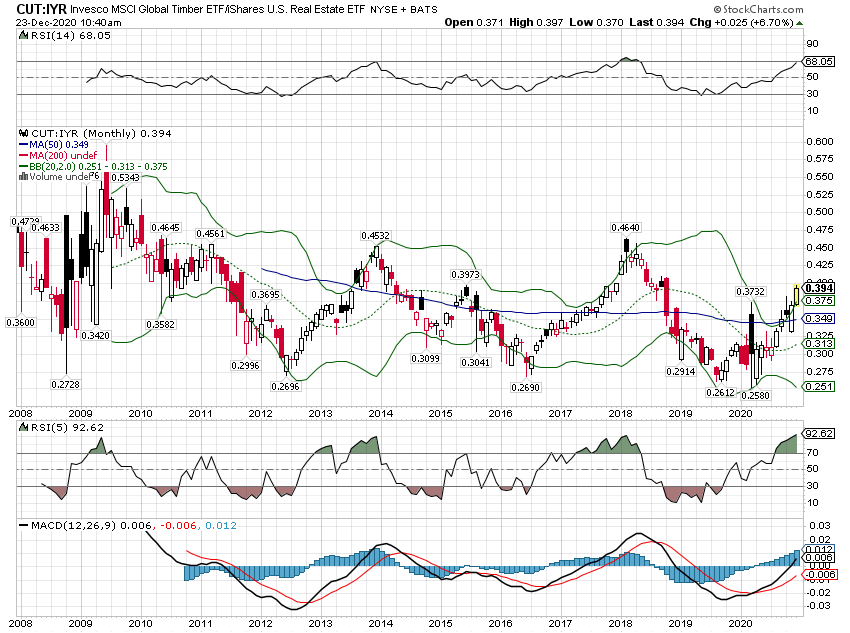
The biggest winners in the real estate space since the virus struck in the spring are the Timber REITs. CUT has outperformed IYR since the lows but the long-term trend is…no trend at all. Unfortunately, I sold our CUT position in the summer when lumber futures peaked. Lumber futures fell hard but rebounded quickly to new highs as real estate continued to boom. As the rest of the economy recovers though, I’d expect real estate to cool off some. We’ll see but for now, I’m standing aside.
Commodities
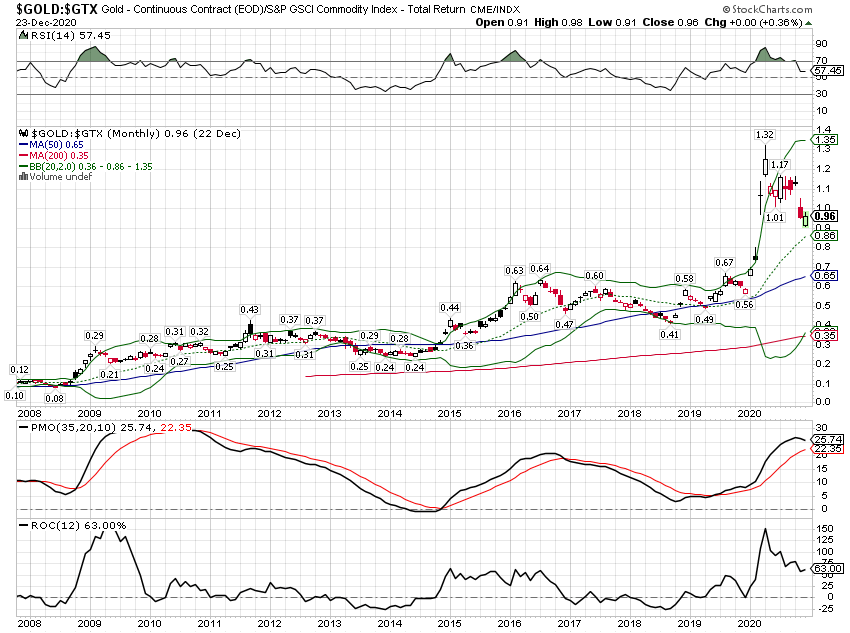
Gold has been in a long-term uptrend versus general commodities since 2009 although there have been 2 multi-year countertrend moves that favored the GSCI during that time. General commodities outperformed from 2012 to 2014 and 2016 to 2018. Gold started to outperform again in 2019 and we entered this year with an overweight to gold. We have since reverted to a balanced allocation with equal amounts in gold and the general commodity indexes. I do not see a reason yet to move to an overweight position in general commodities. That may ultimately be the right move but I want to see a better economic growth backdrop first.
Commodities and gold are both in long-term downtrends versus stocks but in recent years the rate of change slowed. For a period from 2016 to 2018, the general commodity indexes actually matched the S&P 500 return.
Stocks had a great year in 2019 and commodities lagged but even then commodities turned in a good year.
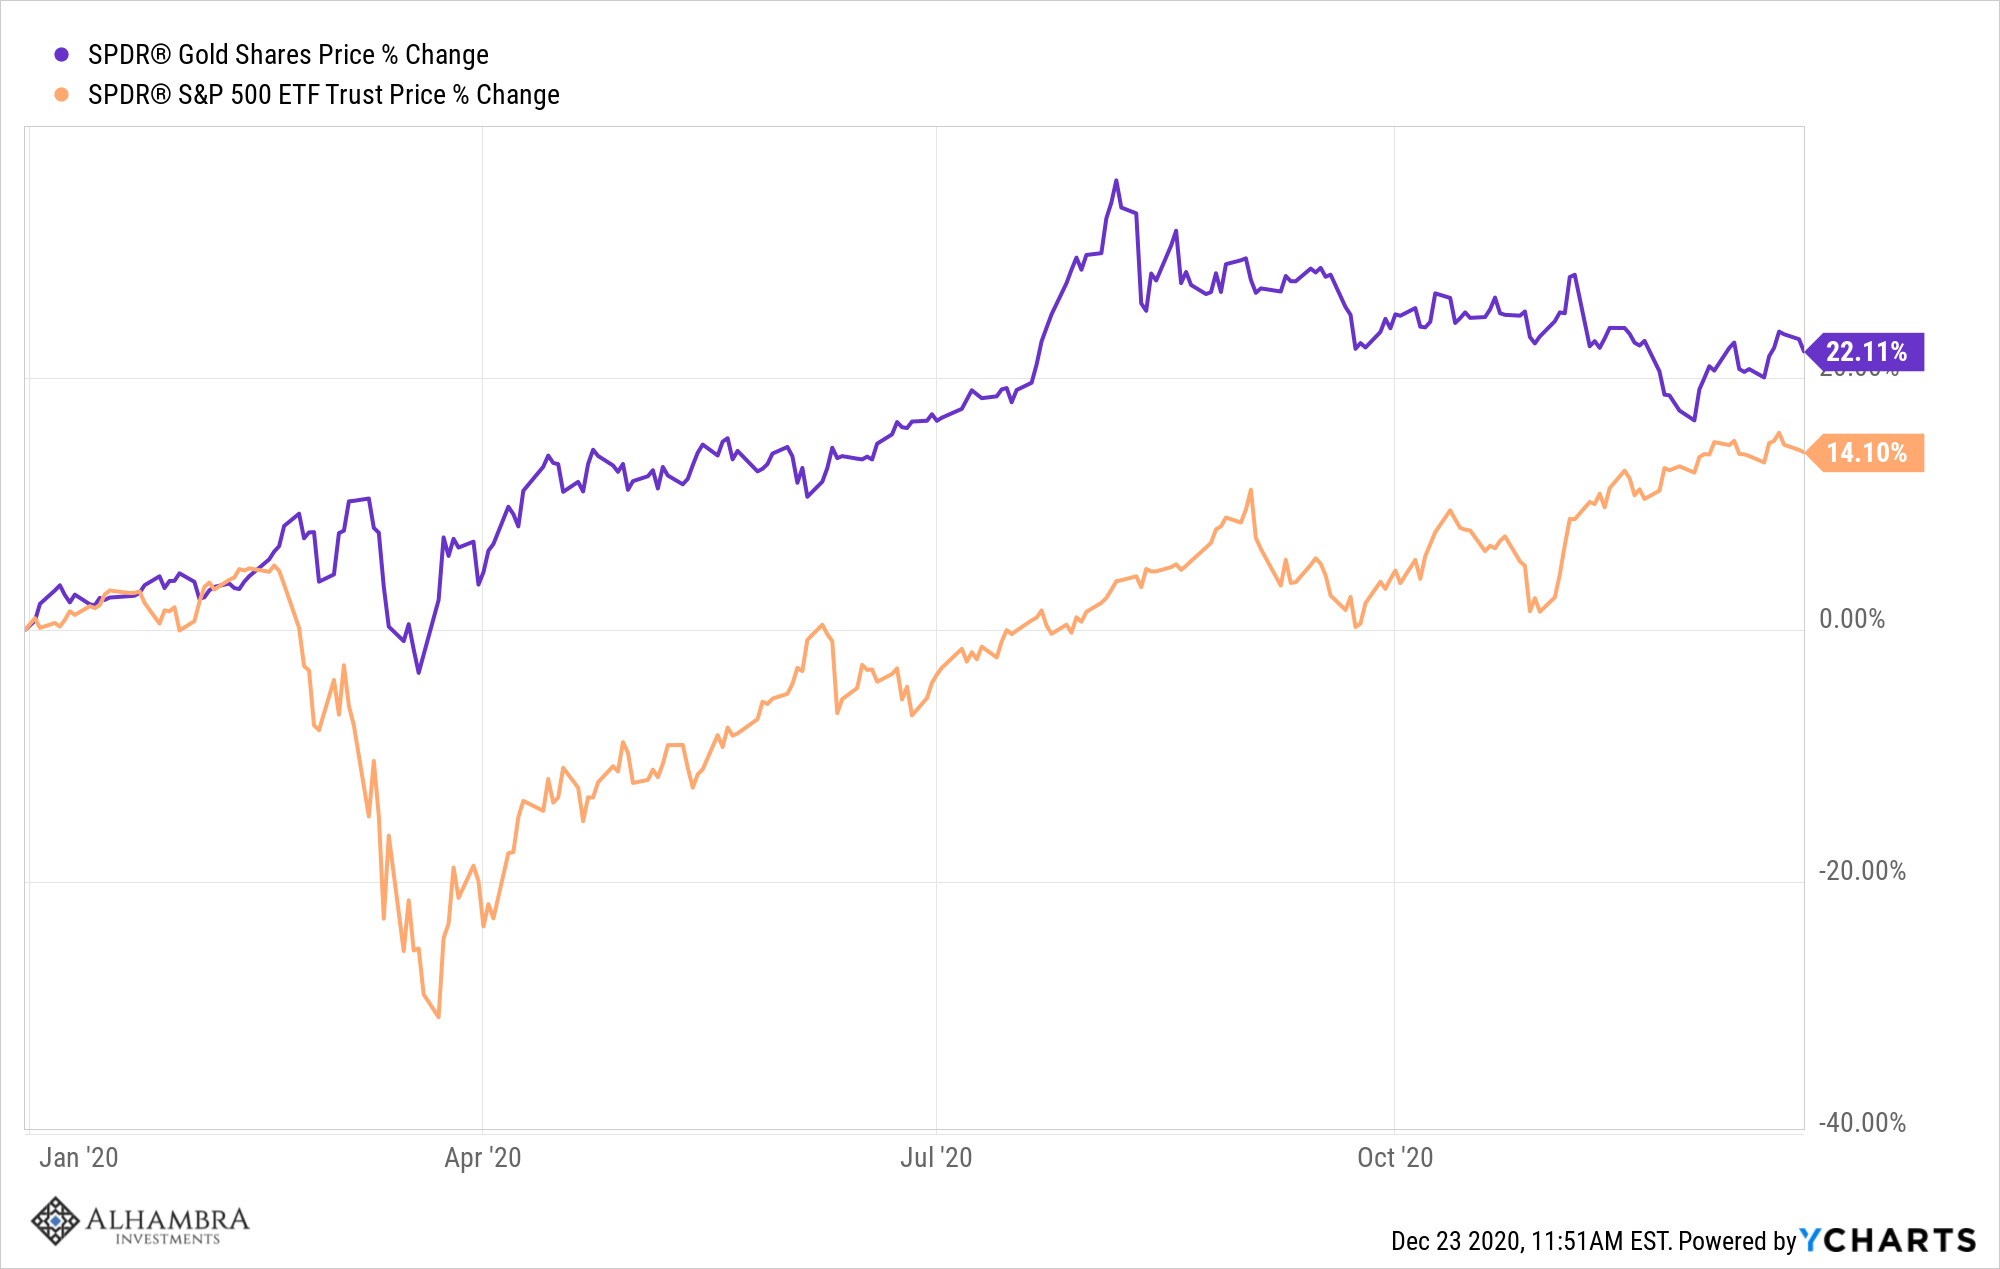
2020 obviously changed that as commodities were hit even harder than stocks in the spring. Gold, on the other hand, outperformed stocks at the onset of the virus and for the year to date:
Since May 1st, commodities have doubled the return of the S&P 500:
But this is just catchup and I don’t think the short-term trend is sufficiently developed to warrant an overweight to commodities versus stocks. That would probably require an acceleration in economic growth and further US dollar weakness that just isn’t happening right now.
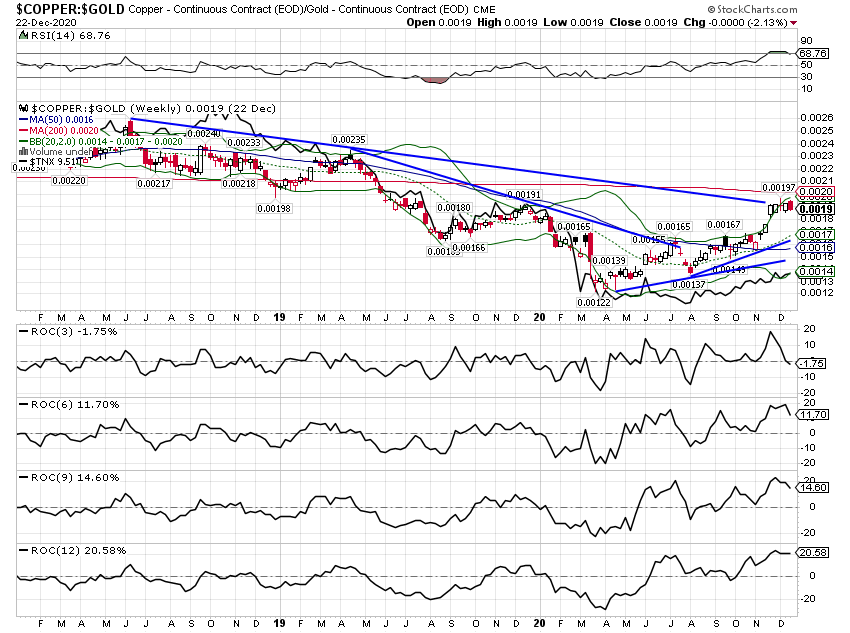
We don’t generally trade individual commodities (ETFs or futures) as it doesn’t fit the profile of most of our fairly conservative client base. We do monitor trends though and these trends will sometimes influence our stock sector or individual security selection. For instance, industrial metals such as copper have outperformed gold recently (as expected in an economic recovery):
This outperformance was a factor in adding two individual mining stocks to our VQM individual stock portfolio. (Sorry, I don’t talk about our individual stock selections in these public commentaries)
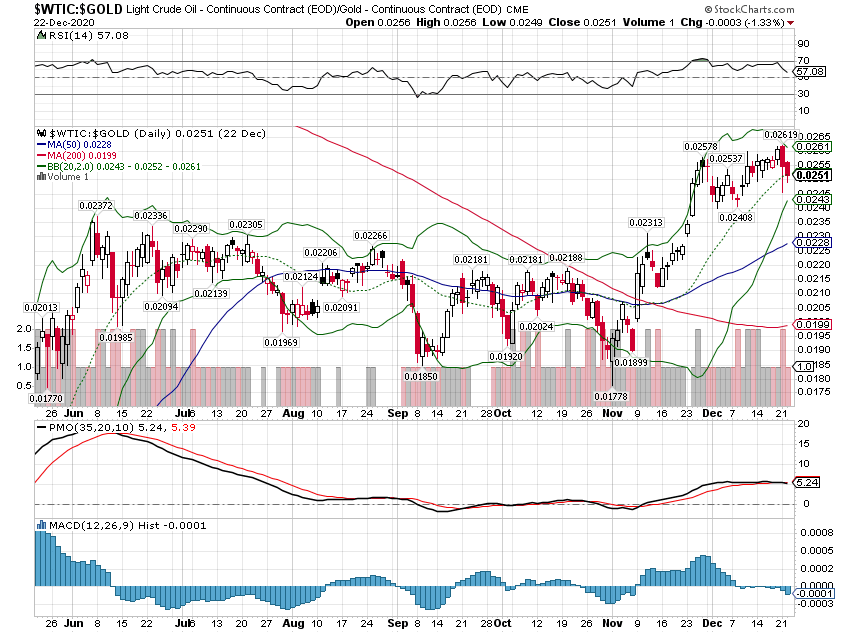
Crude oil’s recent outperformance also played a role in our current allocation to an oil stock ETF.
Bonds
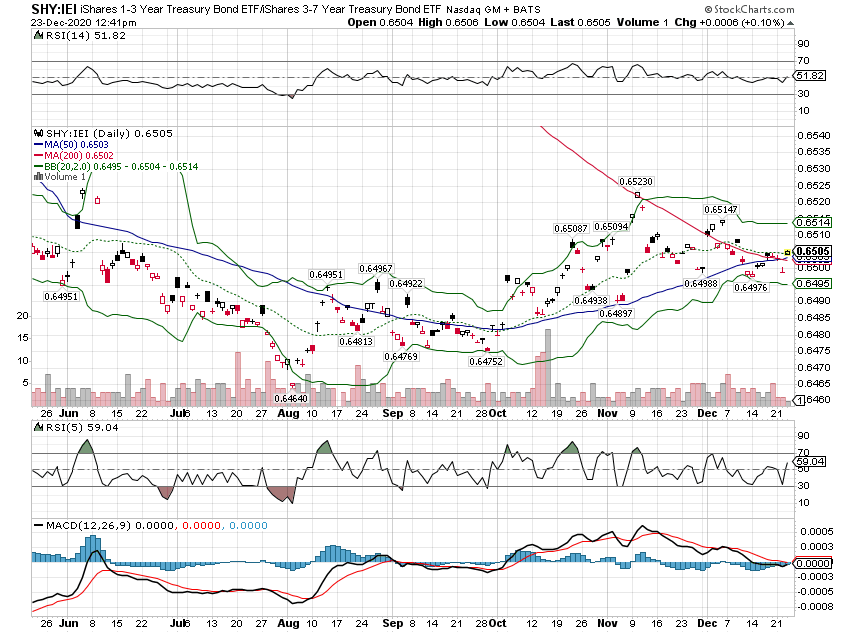
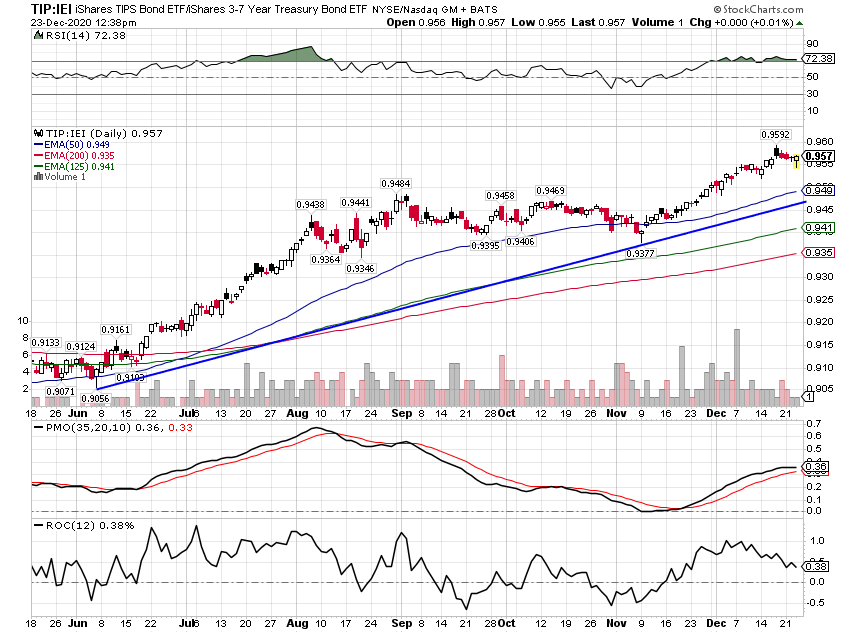
The bond markets have been marked by two trends. First is that short-term bonds are outperforming longer-term bonds as nominal rates rise. This trend started at the beginning of August as nominal growth and inflation expectations started to rise. Not coincidentally, that is also where gold peaked.
The second trend is that real interest rates have not risen along with nominal rates. That means that inflation-protected bonds are outperforming nominal bonds:
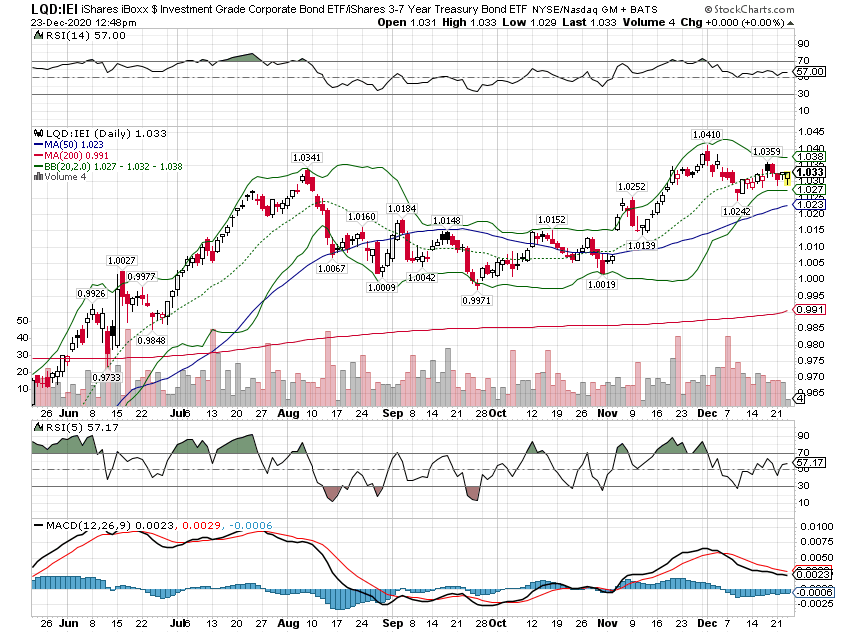
One would expect corporate bonds to do well as growth expectations rise but the outperformance hasn’t been sufficient to warrant the extra risk in my opinion. That is especially true with the economic recovery decelerating.
Our tactical approach is generally to stay with the long-term trends; why swim upstream? But there are times when trends get taken to such extremes that a reversal becomes a low-risk, high-probability event. The move in small-cap stocks relative to large-cap recently is but one obvious, recent example. The move in commodities relative to gold since the spring is another.
Our tactical positioning right now reflects our belief that several other very stretched trends will reverse, at least temporarily. And it may be that some of these long-term trends are coming to an end. Sudden acceleration of a long-established trend often marks a turning point as everybody throws in the towel and joins the trend. We’ve seen a number of those situations develop this year. At this point, I am not willing to say that any of these long-term trends are changing but a partial reversal of an extreme situation seems a reasonable expectation.
One last current tactical choice; we are holding some cash right now due to an underweight position in Large Cap stocks and Real Estate. The economic rebound from the spring shutdown is obviously slowing and the dollar is nearing a long-term support level. With sentiment overly bullish, a cash reserve seems prudent.







Stay In Touch