
Sell-off. No, rout. Heck with that, Armageddon!
It really had been that hysterical at times, and not just because it was declared a foregone conclusion. Certainly a big part of it, the faux certainty, more than that the gross overhyping of what really had been a relatively small change; the whole mainstream was afire with an inflationary mountain fashioned from the smallest (yet) reflationary molehill.
No one seemed willing to factor how these had kept getting weaker. Maybe it was because the rhetoric, at least, had grown inversely proportional to that trend.
The title of Inflation Hysteria #1 was well-earned. See for yourself:
They worry that U.S. bond yields will rise much more dramatically than Wall Street expects. That could force the Federal Reserve to raise interest rates more aggressively to fight inflation — and stop the market rally, slow the economy and make it more expensive for people and businesses to get loans.
A sell-off in bonds could be “the Armageddon event for this year,” Naeem Aslam, chief market analyst for Think Markets UK, wrote in a report Tuesday. [emphasis added]
This wasn’t some small corner of the dark web where feverish rants are exchanged, instead this sort of hyperventilating had become a regular feature for all the conventional news sources (above was produced by CNN in January 2018, below from CNBC, obviously, published just six days before). Central bankers may have been more measured than these sensational pieces, but they had also become noticeably less measured when compared to what they had said in prior years (even 2014).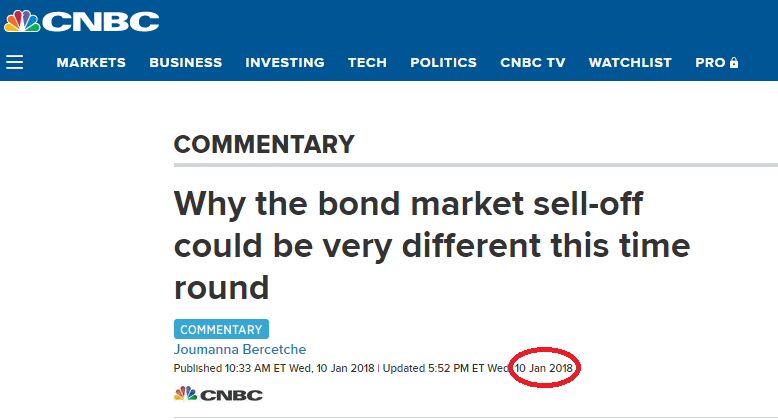
So what’s different this time? Fixed-income specialists point the recent sell-off to multiple factors.
These bond “specialists” offered everything you’ve heard a hundred times every time one of these reflationary periods shows up: from China pouting geopolitically into a “buyer’s strike” of UST’s to QT to the TCJA throwing inflationary gasoline on an economy already on fire.
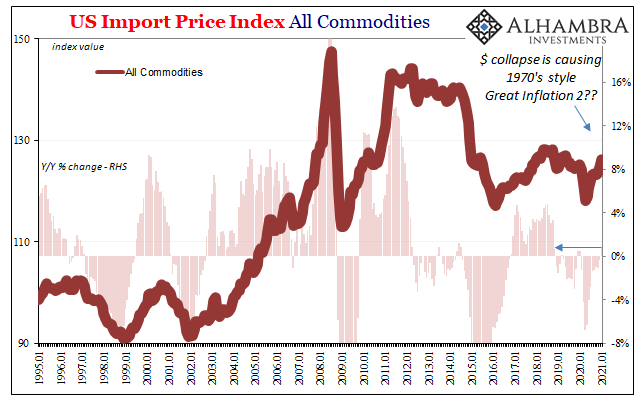
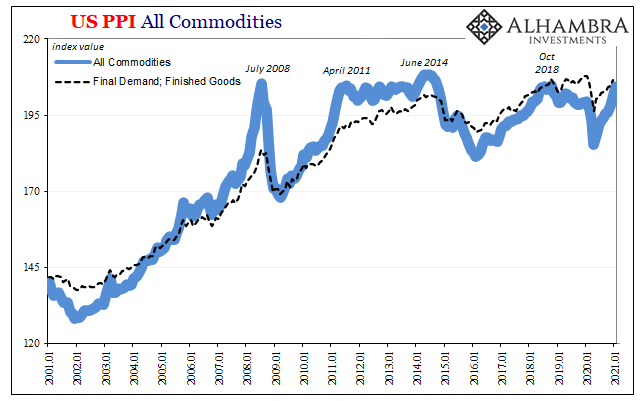
And commodities:
While key underlying measures of inflation are still below 2 percent, commodity prices are in another bullish channel. Oil prices are now at more than three-year highs and have helped boost inflation expectations.

Put altogether, 2018 was a can’t-miss end to the post-2008 shortfall.
Then it missed, badly. This heated gamble, like the hysteria surrounding it, just didn’t pay and not even close. In fact, you could have already known it was failing while all these words were being printed and the beautiful if wrongly-applied cover artistry painted. The inflationary fires were already dying down even as the excited rhetoric surrounding them kept going for quite a while longer; Euro$ #4 had broken out right as the calendar had turned 2018.
But this time, this time, it’s different? Where 2010 didn’t turn out, and 2010-11 fell way short, then 2013, followed by 2017, this year, 2021, they’ve finally decoded the inflation secret?
Why, yes, many are today saying. Shouting. You must’ve seen and heard the palpably dangerous pounding from this bond market sell-off and the skyrocket surge in inflation expectations!
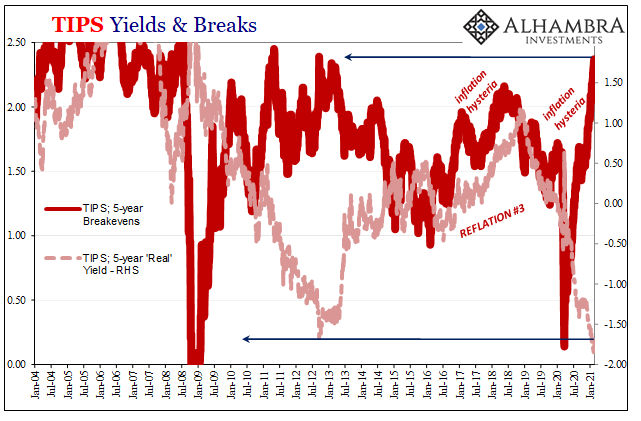
Indeed, beginning with the 5-year TIPS breakevens, this expected inflation rate has visibly jumped over the past couple of months. Going back to the end of November last year, the breakeven rate has added an impressive (sounding) 67 bps and making inflation expectations appear as if they really have gone vertical; apparently the first step toward not just a rerun of 1970’s Great Inflation but then continuing right on into 1920’s Weimar Germany.
The 5s breakeven rate was yesterday the highest since 2012. The real rate, though…
As you move further down the TIPS yield curve, the implications only mellow. The 10-year breakeven has increased by just 39 bps in the same amount of time, such that now the TIPS curve has become its own important sort of “inverted.”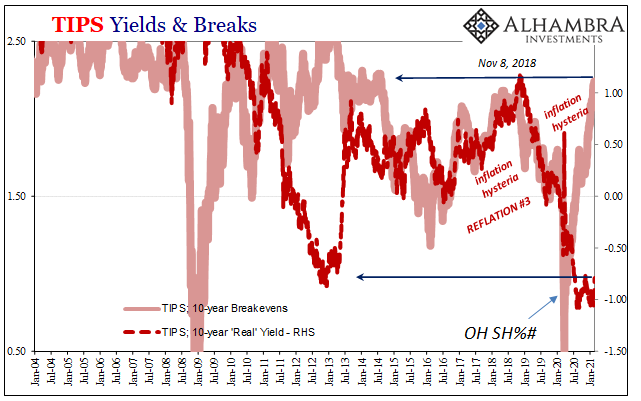
While the 10s break rate is the highest since 2013, both that one and the 5s remain less than they’d been during the pre-crisis era. The excitement over inflation expectation is that – while real yields are near record lows – the market is looking at the same inflation prospects as earlier reflationary periods which didn’t become inflationary in the slightest.
But, the inflation argument goes, can’t you see this is all just getting started?
That’s where the inversion comes in; “hotter” near term, less hot the farther out you go into the long run. By the time you get there, more of the exact same post-Euro$ #3 lethargy.
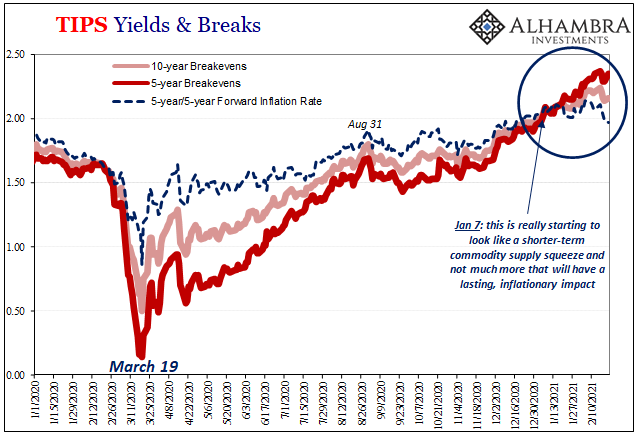
Going back to the commodity surge around early January 2021, the TIPS curve has shifted (inverted) toward pricing future scenarios that incorporate the commodity-based influence more exclusively in the shorter end before becoming (far) more modest even downbeat expectations further down it. In other words, yeah, that big jump in oil and copper will have an impact on prices in the near-term, but it’s not as large as is being claimed nor is being priced to produce a lasting one.
You can really see (and compare) that last part – which is the whole inflation thing – in long run inflation expectations which remain at levels far less hysterically impressive (it all changed in February 2013):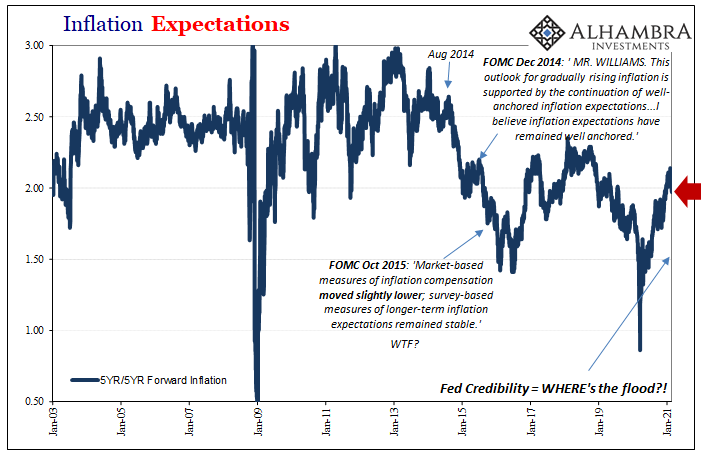
Thus, what might actually be different this time (really shaping up to be Inflation Hysteria #2) when compared to Reflation #3 (Hysteria #1) is a supply-induced commodity squeeze being added on to an underlying reflationary trend which is, overall, absolutely the weakest one yet. A clear recipe for confusion, which is what hysteria thrives most upon.
The fundamentals beyond commodities just do not support a massive, sustained burst of inflationary pressures – only starting with the fact that the global economy is more than a Great “Recession” worse off right now than it had been in late 2017. That’s how TIPS spikes in the front and tails off unremarkably as it inverts down to longer run indications.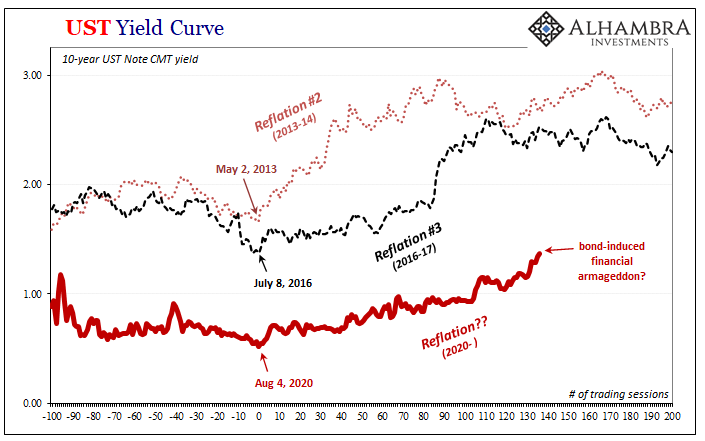
Yes, the long end of the UST curve has sold off, but that’s just what happens during reflationary periods. The more grounded and objective interpretation of the curve and its overall behavior is that bond market participants are starting to think that the next few years just might not be as bad as last year had been (unless you start poking around at what might really be going on at the front end, and it isn’t TGA).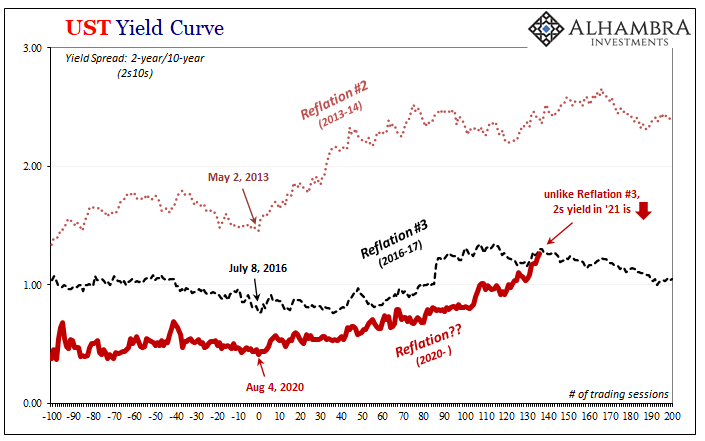
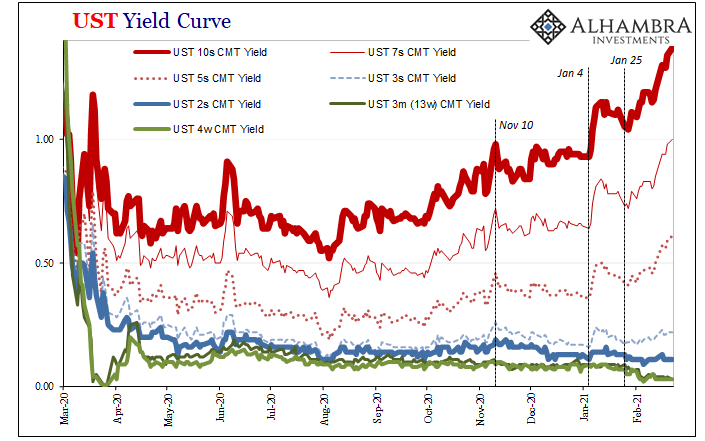
When we look at the current trend in yield curve shape (steepening), there’s just as important a contribution from the 2s (-8 bps since mid-November) as there has been from the 10s (+46 bps) in the 2s10s. Not numerically, obviously, more the short-end implications related to overall risk perceptions (and even some technical money issues spilling over from bills) which are burying rather than buoying shorter-term note yields.
Even the “alarming” “jump” in real yields over the past two weeks isn’t in any way out of line for these periods; that’s what they do, they just never do it nearly enough. In fact, like most everything else another clear indication of weaker than last time: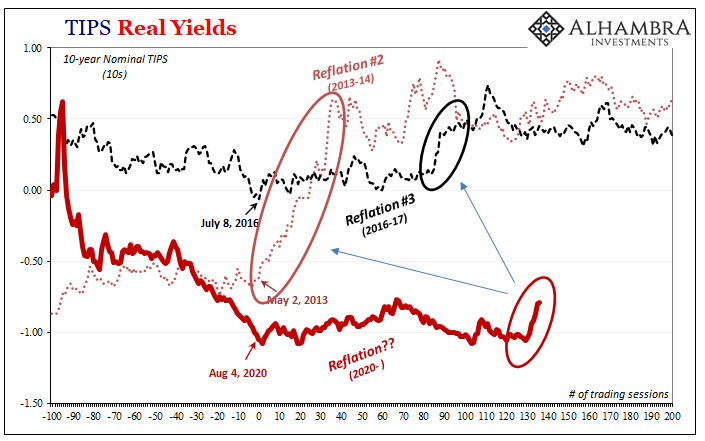
There’s just too much that’s the same (or worse) in 2021 when compared to 2017-18, and that starts with commentary even further detached from realistic market context and the real world. This is true when looking at economic data such as various inflation measures; these market prices and curve shapes discussed here are, in fact, consistent with such low-key data measures as they are.
We are not – in any way – seeing the leading edge of a shift toward out-of-control, overheated systems. Even the commodity pressures are being judged, and priced, as anything but longer run (including the idea of a dollar-debasement-derived supercycle).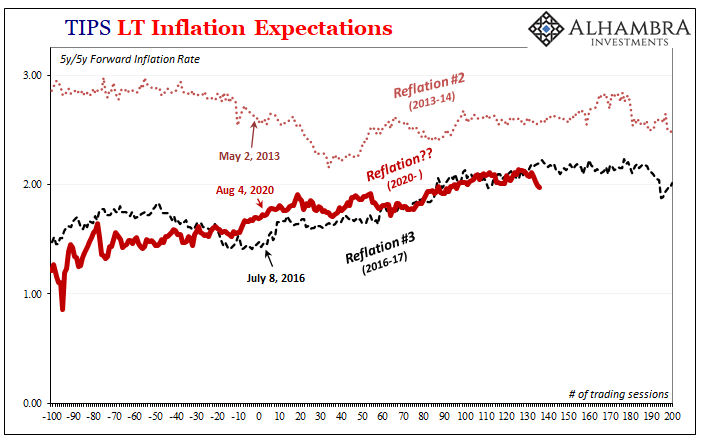
What that most likely means is the same thing it meant three years ago – assuming this is Reflation #4, and I still have my doubts that this isn’t a late 2010-ish head-fake given the economic conditions right now, what should follow is perhaps inevitably Euro$ #5.
When?
That, not inflation, is the question. Still.
Stay In Touch