
There is precedence for this, though not to this extent; it has reached a record. And when it happened before, oil prices were right in the middle of it, too. The 5-year TIPS breakeven rate has surged to equal its highest in a very long time. Considered by many evidence for an inflationary breakout – these are inflation breakevens, after all, and for an important benchmark, too – there is yet a growing inconsistency to first consider.
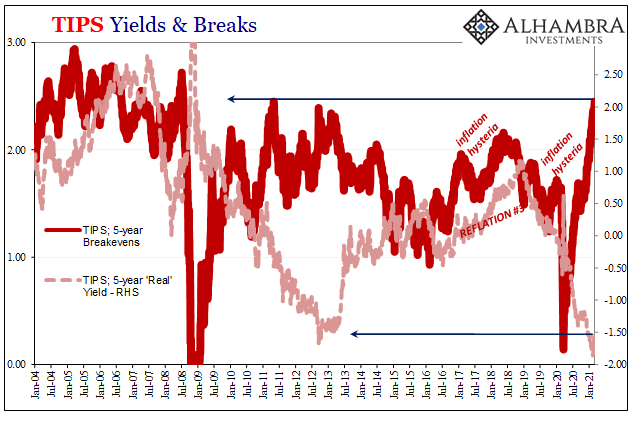
Whereas the 5s are at more than decade highs, the 10s are not. Rising still if much less rapidly, this has created an unusual discrepancy. Typically, there is an upward slope to the inflation curve (such that one exists) like any other money or bond curve; the 10s breakevens will be greater than those at maturities less than 10-years. This has been true for the vast majority of Treasury paying inflation protection.
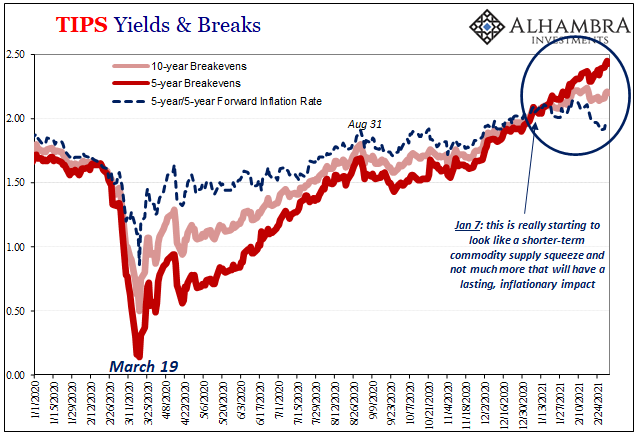
Going back to early January, however, this breakeven situation “inverted” and has only grown more upside down over the weeks since first it developed. As of the past week, it is now inverted by the most in history.
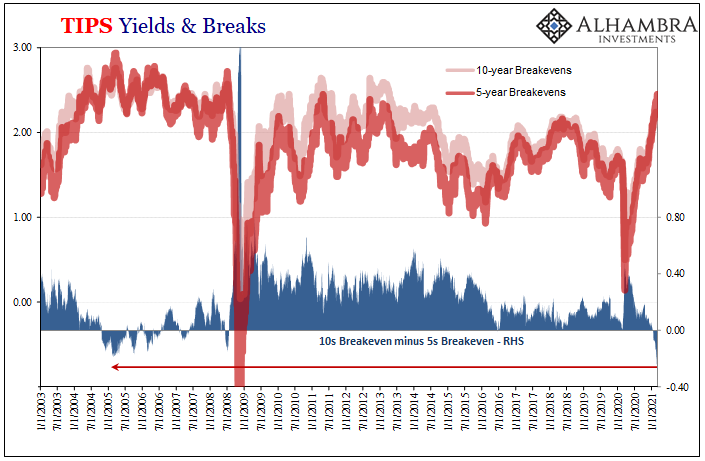
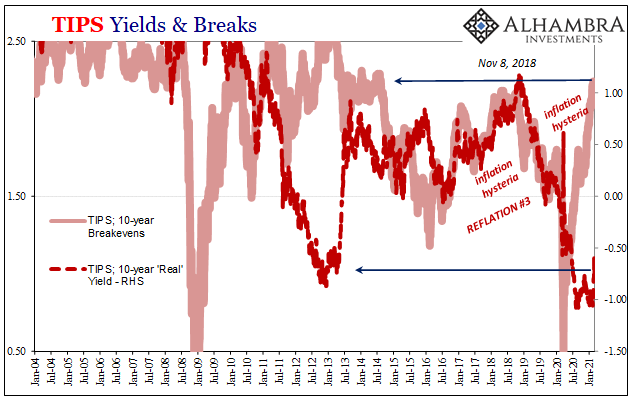
As you can see above, it’s not the only time in trading experience; going back to the middle of the first decade of the 21st century, the blowout 2000’s with its housing bubble and eurodollar monetary explosion both feeding into rapidly rising crude oil prices.
Then, as now, the market was pricing short-term inflationary results as a consequence of rising WTI, but that it wouldn’t alter the longer run inflation picture – expectations, in the parlance of Economics and central bankers, remained well anchored no matter the general commodity frenzy.
But if oil prices didn’t dislodge long run expectations, and they sure didn’t, the first Global Financial Crisis began to, a task ultimately completed in the wake of Euro$ #2; specifically, the misunderstood, misidentified “taper tantrum” period of 2013.
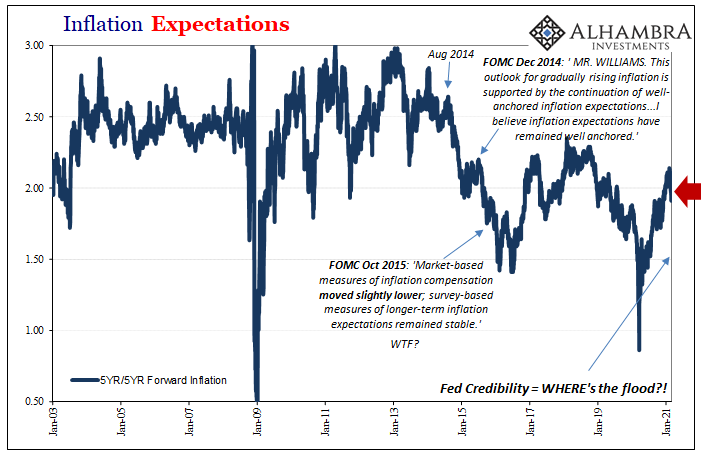
So, like the middle 2000’s, this inverted TIPS situation suggests the same thing in reverse; whereas rising oil prices hadn’t unanchored long run inflation expectations back then, failing to convince them upward and therefore indicating a more serious inflationary condition, nowadays the rise in oil prices has yet to alter the long run expectation only this time unable to push it out of its post-2013 deflationary rut.
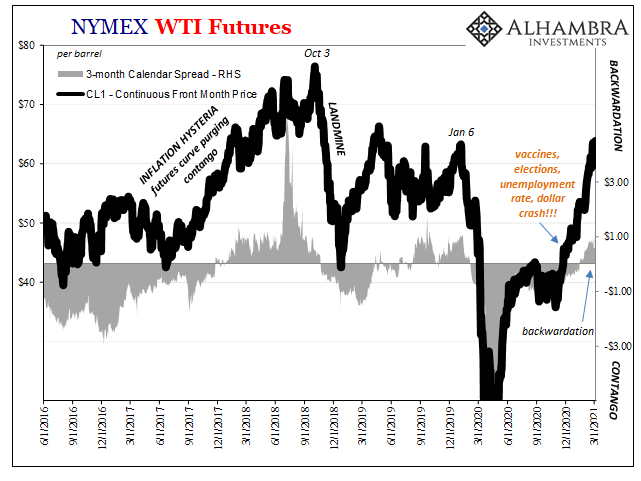
The congruence and consistency make more sense in light of what’s really been driving crude since late last year, and it isn’t demand nor “money printing.” Those would show up in the longer run expectations numbers first and foremost where they are instead noticeably absent (especially the 5y5y).
Oil, like a lot of commodities, is being pressured higher on a supply squeeze, some of which is, well, intentional:
OPEC and its allies said Thursday they are keeping oil production largely steady, even as crude prices stage a remarkable recovery, betting that a restrained approach will lay the groundwork for prices to climb even more.
Russia and Kazakhstan will raise their output modestly, but all other members of the alliance will hold their production steady instead of returning more oil to the global market. Saudi Arabia also said it will extend its voluntary cut in oil production of 1 million barrels per day into April.
It’s no different in the domestic economy, either, where US production remains more than one-fifth below its March 2020 peak (the last few percent due to Texas weather issues last month).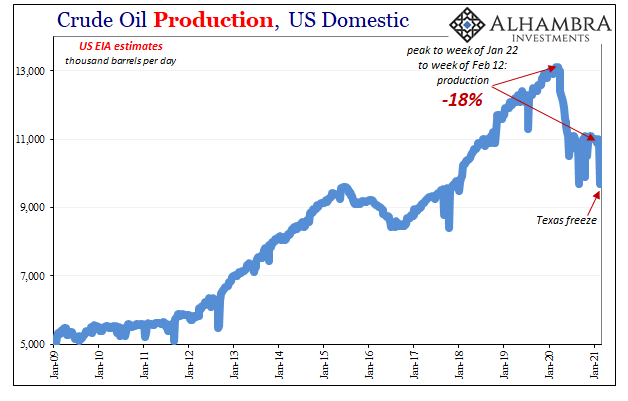
Commodity prices are scorching, but the economy…is not. It isn’t now and inflation expectations further down the curve, far more influenced by the probable outcome in the latter, aren’t giving it much chance to get all that much better. Given where the economic rebound is now, or is not now, you can see why there’s now a historical level of TIPS breakevens inversion.
The difference is becoming an equal extreme.
The economy of today remains flat out awful, and commodity prices, even WTI and Brent, in their own way (being supply constrained) are consistent with that. More production might mean a lower price, but for the global economy badly in need of activity rather than higher oil prices (sorry, Jay), this, too, is way upside down. 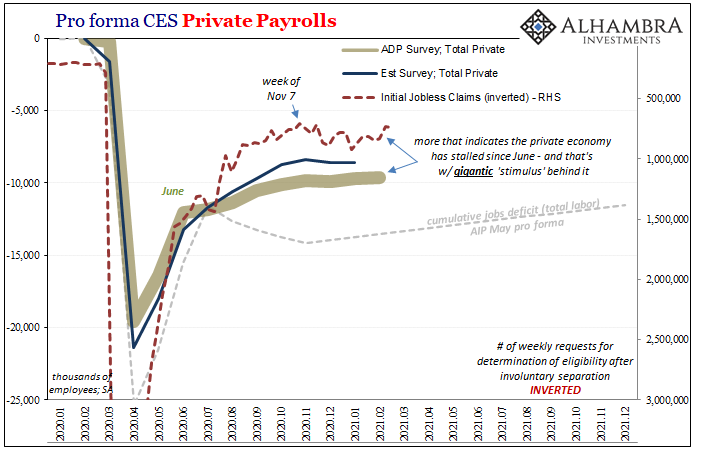
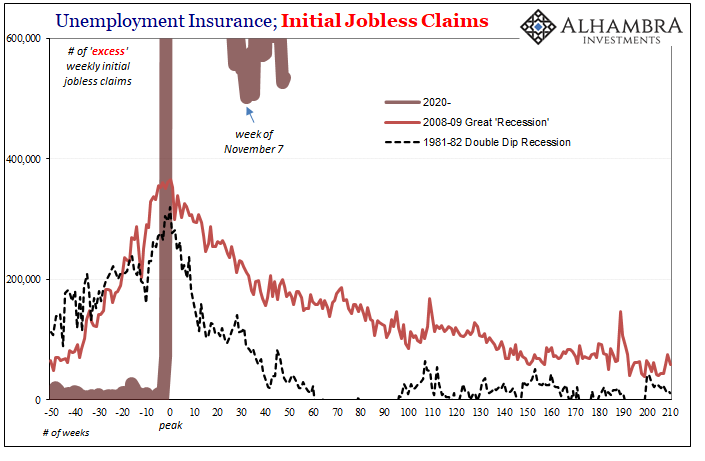
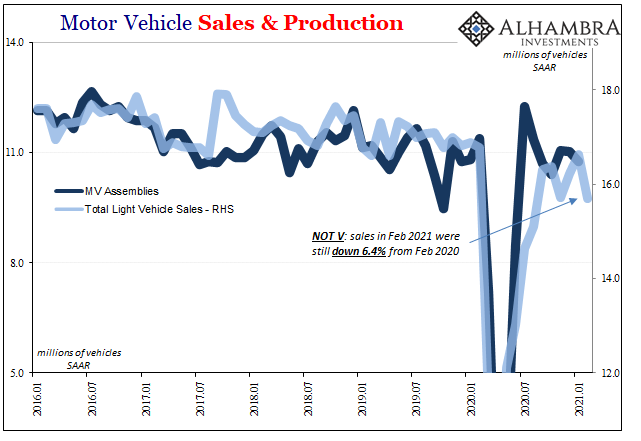
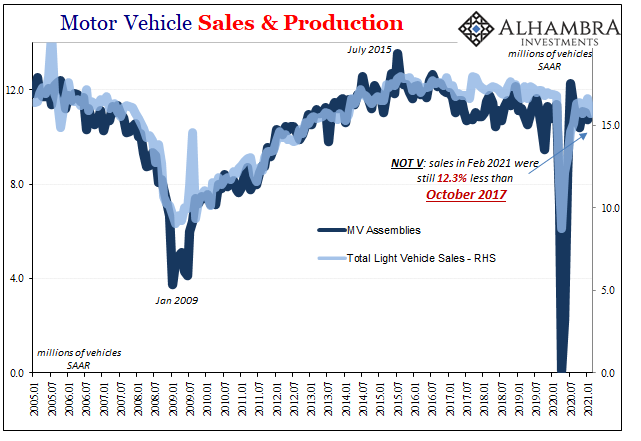
More confirmation yet again today as jobless claims remain above 700,000 for the 50th consecutive week, after decidedly weak payrolls indicated by ADP yesterday, and then the first set of estimates for February 2020 auto sales which totally defy both the recovery idea as well as the picture of consumer spending in retail sales.
Altogether, the economy is still improving but way too slowly and certainly not in some out-of-control inflationary manner. Oil prices are, in this sense, misleading as they aren’t reflecting full and honest recovery (what would oil prices be today if production was raised to early 2020 levels?) That incongruity is being corrected (not that you hear about any of this in the mainstream cheerleading) by this other divergence in inflation expectations (TIPS inversion), which remain anchored well outside any possible notion of “money printing” no matter how high commodities get squeezed.
In fact, thus far, the higher oil goes the more this correction stands out.
Stay In Touch