
On December 26, 2018, the US Treasury sold off $41 billion in 5-year notes. “Only” $85.8 billion in bids were submitted, weakening the widely watched bid-to-cover ratio to a chatty 2.09. The prior sale of 5s had yielded a bid-to-cover of 2.495, nearly $100 billion in bids for $40 billion on offer, so something was clearly up.
Had it been finally “too many” Treasuries as had been claimed all year to that point? Or had traders taken their sweet time returning to dealer warehouse duty following the Christmas holiday off?
No, it had been a (clear) sign of the times meaning a signal at the time no one wanted to receive or appreciate. Remember, Jay Powell the hawk was homing in on accelerated inflation demanding what he forecast would be an enhanced rate hike timetable from the Fed. Things were, he claimed only weeks beforehand, proceeding according to that schedule.
Yet, by then, especially Christmas Eve 2018 trading, it was as if safe and liquid instruments were scarcely available in the secondary market. Treasury prices had reversed under serious and sustained demand. The global marketplace was uniform in declaring renewed fears driving the need for more safety and higher liquidity preferences; renewed deflation rather than a paradigm change toward inflation.
When we think about how the system actually works, the “bad” auction of December 26, 2018, actually makes a lot of sense even in the context of very strong secondary demand. What is it that creates this global illiquidity anyway, the substance of these occasional global dollar shortages?
Lack of money dealing, the constraints on dealers’ balance sheets which can manifest in seemingly odd ways.
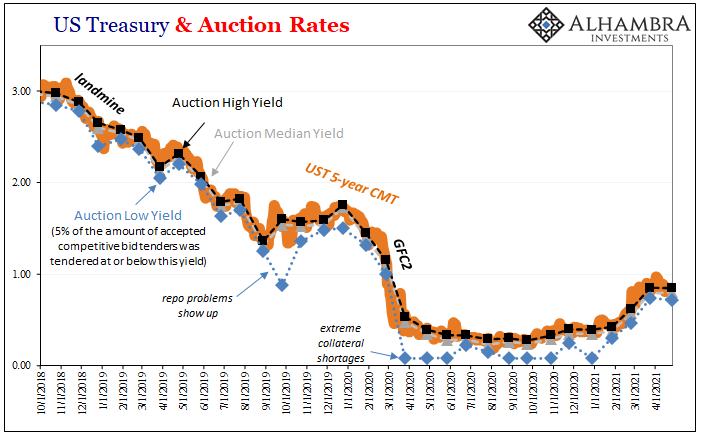
As this “landmine” of a reversal reached its short run crescendo late in ’18 and in the first few days of ‘19, the two things happened simultaneously while appearing to be in opposition but in actuality consistent: the secondary market wanted Treasuries, as many as possible, while at the same time dealers were prevented from getting all they might have representing the substance of illiquidity driving the demand for safety in the first place.
Since that late December 2018 auction, 5-year note sales haven’t seen close to that few relative bids again. The lowest bid-to-cover was, incidentally, for a relatively recent $62 billion operation conducted on…February 24 of this year.
Yes, that February 24.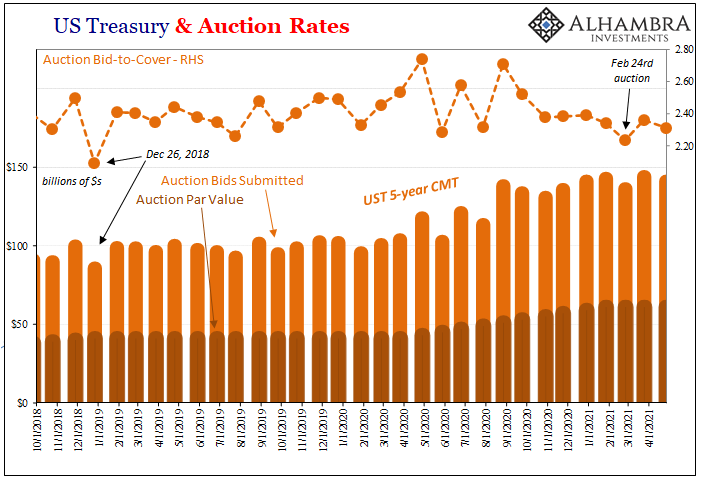
As I’ve pointed out, everyone remembers the 7-year auction on the 25th for how much it resembled the bid-to-cover problems of the 5-year auction back from December 2018. As I’ve also documented, two days before this, on the 23rd, Treasury had been able to auction off 2-year notes without so much as a hint of irregularity.
That had left just the specific 7-year auction on the 25th to stand out alone…well, almost by itself.
While it wasn’t nearly the same kind of outlier, the 5-year sale on February 24 featured the outlines of what would become of the 7-year the next day. A slightly but noticeably lower bid-to-cover as dealers were kind of missing at the margins, but nothing like the deficiency had been in December 2018.
This suggested that what was going to follow on the 25th in the 7s, and the huge Treasury market selloff it sparked, had begun to some detectable extent on the 24th in the 5s. Interestingly enough, the cutoff for competitive bids for this particular 5-year sale was the usual 1pm ET.
According to what little we know from authorities, the Fedwire disruption was first noticed at 11:15am ET – just as dealers were finalizing their bids, books, and diagnosing their own liquidity parameters for the rest of that day and almost certainly the potential bottleneck spilling over into the next. And yes, Fedwire most often does link final settlement in the primary Treasury market.
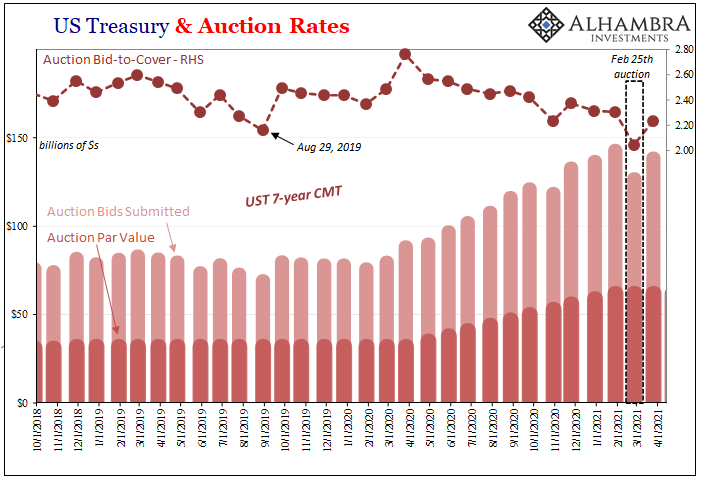
In other words, a perfectly fine 2-year auction on the 23rd, a perceptibly weaker but not awful sale of 5-year notes on the 24th, completed amidst the outage, and then one of the uglier 7-year (or any note tenor) auctions on the 25th igniting widespread selling up and down the curve.
That sell-off on the 25th though general had been particularly focused on the belly of the curve right where the 5s and 7s sit; on the one hand, those were the two auctions leading in this direction, while on the other the belly is most sensitive to reflationary perceptions.
But had it really been growing confidence even certainty in reflation which had driven these changes and then the auction trajectory as laid out here? Not just reflation, mind you, according to most if not almost all media sources this was the big one; the reflation of all reflations which could only precede the bond market’s full-blown conversion and initial membership into the inflationary cult. 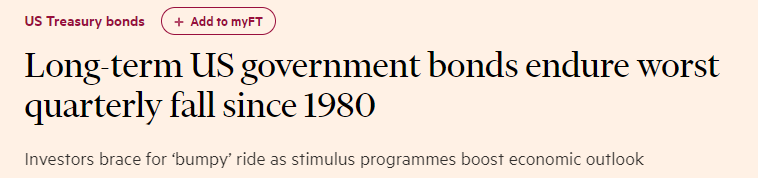
From a decade’s worth of skepticism, the selloff in bonds this year – punctuated by Feb 25 – is talked about as some categorical change in outlook. On that very day, Reuters put it this way:
Traders anticipating rising inflation accelerated a bond sell-off and sent U.S. Treasury yields to new milestone highs on Thursday… Analysts said the trading showed investors positioning for price increases on goods and services internationally, even after top U.S. Federal Reserve and European Central Bank officials tried to talk down rising yields.
“It’s starting to become a momentum trade and the sell-off is becoming a global phenomenon,” said Subadra Rajappa, head of U.S. rates strategy at Societe Generale.
And this was one of the more level-headed recaps of that chaotic session.
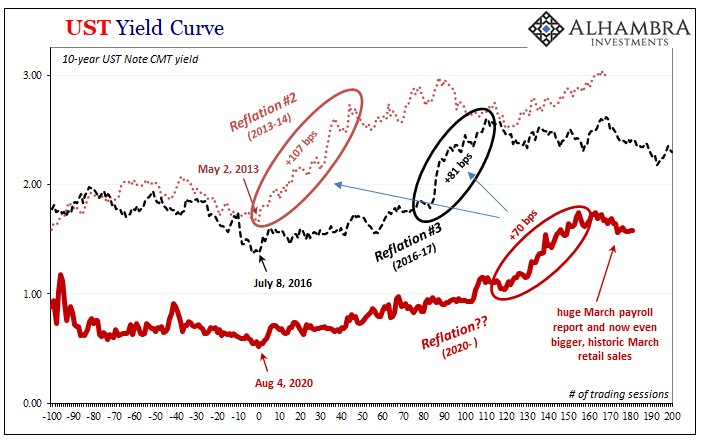
It also ended up being the end of reflation for at least the past two months (and counting) across global markets. In other words, how could it have been mounting reflationary pressures breaking out when the result thus far has become more and more its opposite?
“Investors positioning for price increases” doesn’t necessarily mean that high levels of inflation are being priced into the market, nor the idea that such high inflation is but the beginning of a completely different era where it comes to consumer prices (and related economy or monetary factors). On the contrary, it might have all been nothing more than a relatively minor affair.
Compared to last year when outright deflation wasn’t just a risk, it happened, any small improvement in outlook would be consistent with “investors positioning for price increases.” But somewhat-better-than-absurdly-awful just doesn’t sell, not really.
Looking at where things stand right now in the belly of the Treasury curve, as the rest of it, it’s nothing like how this all gets described. This year and next, maybe over the few thereafter, won’t be as bad as last year. Big whup. Improvement, to be sure, but not exactly an optimistic take on the situation. 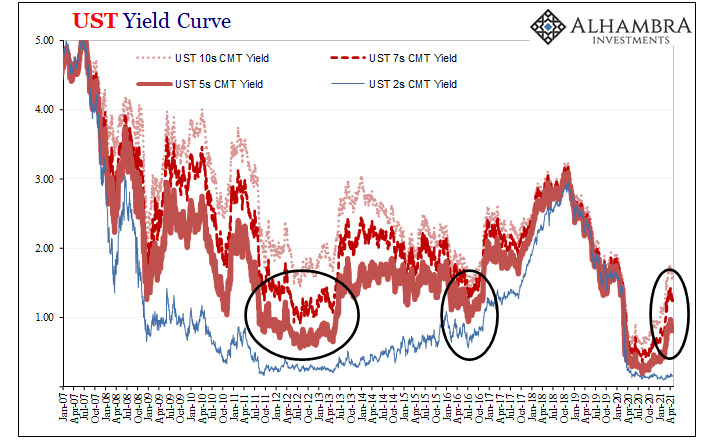
As of today, two months after the events of late February, the middle of the yield curve stands a bit lower than its worst points of the 2014-16 period (Euro$ #3) and about the same as the lows 2011-13 (Euro$ #2). I’ll repeat that: currently the middle part of the curve, the piece that has been most obviously reflation-y in 2021, even following this “historic” selloff is no more elevated than it had been compared to some of the worst times of the previous decade (which did not, you’ll recall, turn out either to be inflationary or recovery).
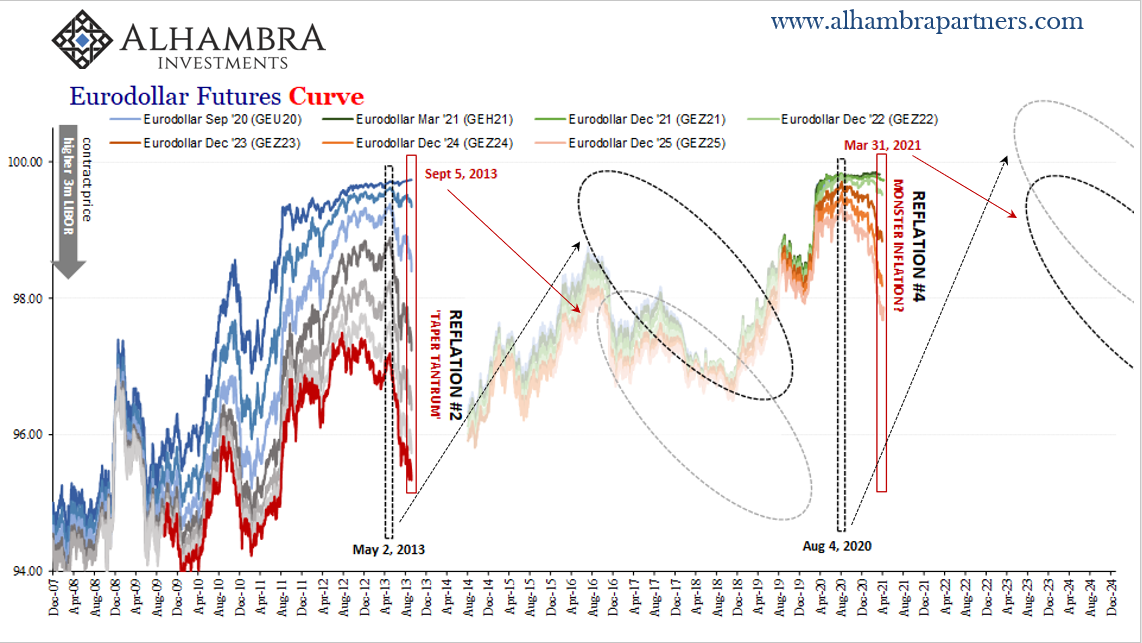
I said the same of eurodollar futures recently, and here we are with the Treasury market making the same case: that 2021’s best (or better) case is today about the same as the some of worst cases (lowest inflation probabilities) priced during that awful decade of the 2010’s.
It may not seem like it, but the deflation case – not inflation – remains the consensus. Not in the media, of course, which presents a uniform view. But the whole damn bond market globally is resolute, and that's so bigger and more powerful.@MacroVoices https://t.co/qMnhOSv6sR pic.twitter.com/FUVOoDFd8K
— Jeffrey P. Snider (@JeffSnider_AIP) April 16, 2021
A key reason for that is…dealers.
Skittish, risk averse, disappearing at the first sign of abnormality, here we see that two months after something like this has happened for the umpteenth time since August 2007 suddenly reflation is no longer trending in any parts of the global bond market – including the belly of the UST curve. Its only presence currently has been in the media – including today:
Though bond investors have gotten a reprieve over the last month as yields have drifted lower, there’s still caution around stepping into long-dated debt as the U.S. economic pictures continues to brighten.
“The spike in rates earlier this year clearly spooked some investors, who are now reevaluating the risk-reward of owning duration,” said Nate Geraci, president of advisory firm The ETF Store. “Investors are becoming much more reluctant to stand in front of the rate freight train.”
Liquidity risks, real and perceived, that’s what has spooked more than some and that’s the monetary constraint, the one that lingers and ripples throughout the entire (global) system far more and far longer than what should have been a curious little nothing (Fedwire). Two months and counting, that has been the freight train – the same one on the same track following the same post-2007 schedule.
The secondary market (including basis trader hedge funds performing systemic warehouse duties) wants too much safe and liquid instruments (a fact that governments are exploiting even if they don’t realize this) even after how everything has gone “right” including trillions in government madness (which in a sane world really would be blowing up the Treasury market). These individual anomalies, including “bad” Treasury auctions, are actually a reminder why that might be.
Deflation continues to be the underlying base case – why rates haven’t moved all that much since even when Treasury auctions go askew it’s still not for the reasons they “should.” 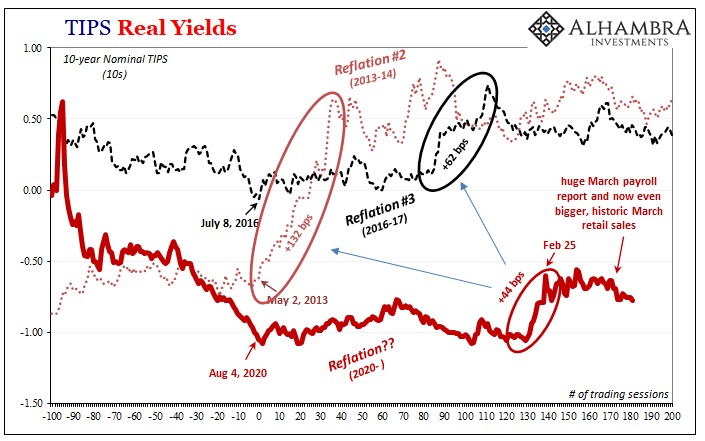
Stay In Touch