
Why do economic data providers continue to overstate reflationary periods? This is more substantial than a pet peeve, though to many if not most it might seem like splitting hairs. We’ve seen this happen repeatedly with each eurodollar cycle. The more egregious economic overstatements were definitely 2014’s, the data errors contributing at least something to the confusion and narrative mistake, yet the same keep piling up even today as if no one learns from it.
High frequency data in order to be high frequency has to be gathered from a smaller sample size. Nature of the beast. This, however, leaves open a more than a trivial chance of allowing imprecision to enter and taint the data. Add to this subjective application of statistical elements, particularly the oft-misaligned “trend-cycle” component, suddenly bigger revisions have become more common post-2008.
To put it simply, and what happened repeatedly during Reflation #2 (2013-14), was how these subjective and more error-prone process components helped fuel the idea that the economy was more robust than it really had been; adding some unknown degree of gravitas to the recovery narrative while it was undermined, correctly, as it turned out, by any number of real-time (bond) market indications.
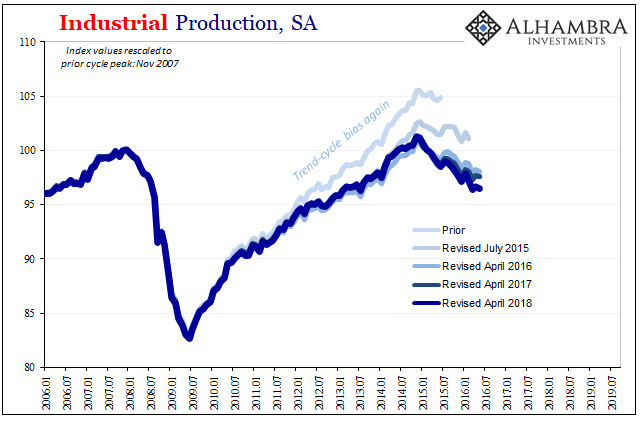
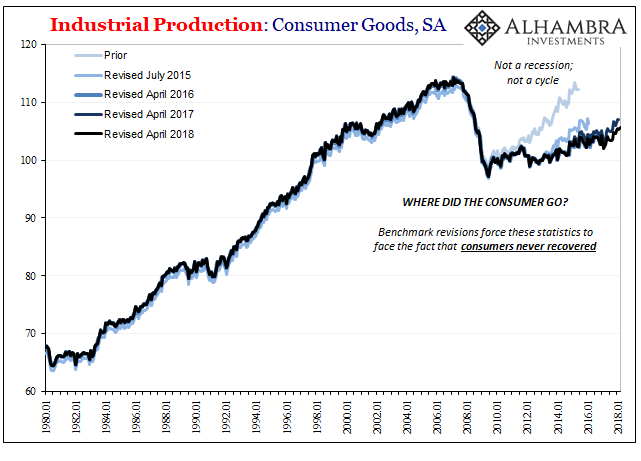
The worst offender was the Fed’s Industrial Production numbers. Big swing and a miss, particularly for the production of consumer goods. What was a recovery-like rebound after 2012 in the original data runs got whittled down benchmark revision after benchmark revision so that in the end – and only years afterward – do we find out the awesome economy of 2014 poised for liftoff was nothing of the sort; moribund and still grounded.
The high frequency data is supplemented in this way because the government’s statisticians know their own weaknesses.
Today, the current estimates for retail sales were not actually comparable to prior figures released all the way up to last month’s. Each and every May (with the exception of 2019, owing to the government shutdown), the Census Bureau releases its revised benchmarks which impact historical estimates and then the current and upcoming estimates are built up from them.
At now lower levels.
To come up with gross US retail sales, the agency doesn’t sort and count up the retail receipts from transaction completed by every retail outlet across the economy. They start with a monthly sample, called the Monthly Retail Trade Surveys (MRTS), and then each year supplement them with a broader survey drawn from a much larger population called the Annual Retail Trade Survey (ARTS).
From ARTS, the previous year’s MRTS estimates get adjusted according to the more comprehensive lower frequency set.
And then every five years ARTS are indirectly attuned according to the granddaddy of them all: the Economic Census (the last one conducted in 2017).
What we keep finding is that the higher frequency data has trouble picking up on and accurately picturing after the eurodollar-based downturns. When the benchmark revisions were published in May 2015, for instance, retail sales estimates were revised pretty significantly downward. Though they only amounted to what may have seemed like a pittance, a few billion in sales that never happened each month for a series where total sales run into the hundreds of billions, it really does add up and add something to the overall picture.
From my May 2015 thoughts on those revisions:
Again, the benchmark changes are not enormous in the individual monthly figures, but $7 billion is also not trivial especially as that accumulates over the course of time. For all of 2014, there is now $64 billion less in cumulative retail sales due to this benchmark change. Going back to the start of 2012, the cumulative change is $171.3 billion, really placing some greater emphasis on the 2012 slowdown. It adds a great deal of weight to the idea that numerous economic accounts are overestimating positive variation due to nothing more than the assumed trend-cycle component.
I noted then how this was even more inconsistent with the unemployment rate and labor stats like the Establishment Survey – the so-called “best jobs market in decades” that would’ve been even more isolated had the proper estimates for retail sales (along with IP and so many other accounts) been available at the time.
Instead, only after several years did the benchmarks fess up to the reality. Those low and falling Treasury yields in 2014 into 2015 had more of a point – in data terms – than it had seemed back at the time.
Moving forward to more recent updates, the revision process has exposed similar overstatements in retail sales going back to – drum roll – April and May 2018 (imagine that, I write sardonically). The current May 2021 version of benchmark changes has rewritten the retail sales history of the past three years such that, like 2015, we find out there really had been less to that “boom” than it had appeared at the time.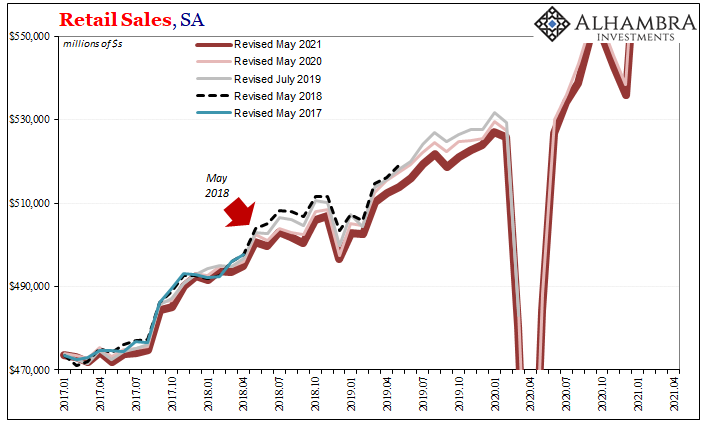
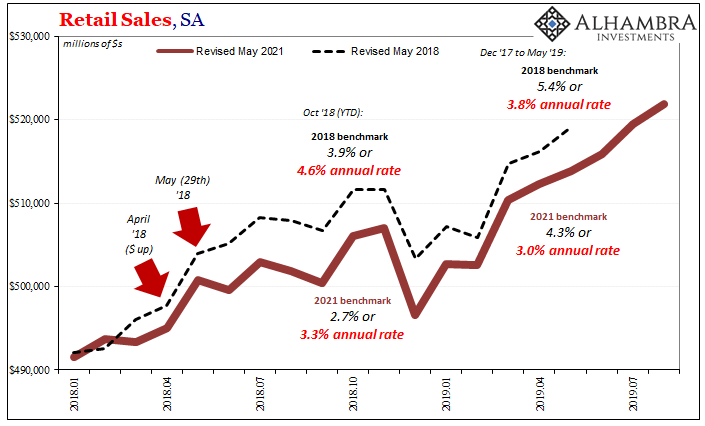
Again, at first it may seem like, what’s the big deal? But imagine how maybe things might’ve been much clearer had the new benchmarks been in place contemporarily. For the month of October 2018, a particularly crucial month given what was about to happen (landmine), back them it seemed like retail sales growth was slowing a bit (the 4.6% annual rate shown above) but nothing really amiss.
This was the official line, if you recall: a minor slowdown from late 2017’s booming boom, thus no bother to Jay Powell’s inflationary forecasting replete with the appropriate rate hikes galore.
In reality, or what Census now thinks about 2018’s “boom”, by that October retail sales were in actuality (or closer to it) up just 2.7%, or a 3.3% annual rate which is very close to recession territory and thus a little more alarming for Chairman Powell. Down toward that level would propose a greater likelihood of more substantial weakness – as eurodollar futures flattening and inversion and yield curve flatness were right then saying.
The landmine which immediately followed October 2018 caught Powell, the mainstream, and the Census Bureau by complete surprise when in fact a more realistic assessment of the economic data would have further backed up market skepticism about this “boom” and more so how long it might be sustained (or not, as it turned out) given what really had been substantial risks to it.
Like those 2014 benchmark changes, by the time they get calculated and issued to the public, the public is already several years down the road and could not possibly care less, still happy today thinking back on the “good” times in 2018 therefore unable to properly assess how we remain stuck – year after year – in this disinflationary mess.
To that end, the revisions end up being worthless.
Thus, it’s more than a pet peeve. It’s a real problem. And it keeps happening. The bond market (not stocks) proposes serious economic skepticism and the original run of data appears to be somewhere in the middle, ambiguous, only to be changed long afterward, several years into the future to show that, yes, bonds were right all along. Risks weren’t just real, it was real weakness.
Something else to keep in mind in 2021 (and, sadly, beyond).
Stay In Touch